Telge Energi
Building a MVP app for consumers to track their energy consumption
Background
Telge Energi was lagging behind their competitors. After record electricty prices in 2022, their customers had an increasing awareness of the energy market and demanded better ways to track their energy consumption. An app was seen as a hygiene factor for an energy company of their size.
Our task
Get an MVP of the app out as quick as possibly to satisfy customer demand.
The client
Telge Energi was an energy provider based in Södertälje, Sweden.
my role
I was the Lead Designer and responsible for visual design in a team of a UX Designer, a UX intern, 3 Flutter developers and a BA
DELIVERABLES
UX design
Visual design
App design
Design system
Aligning on the vision
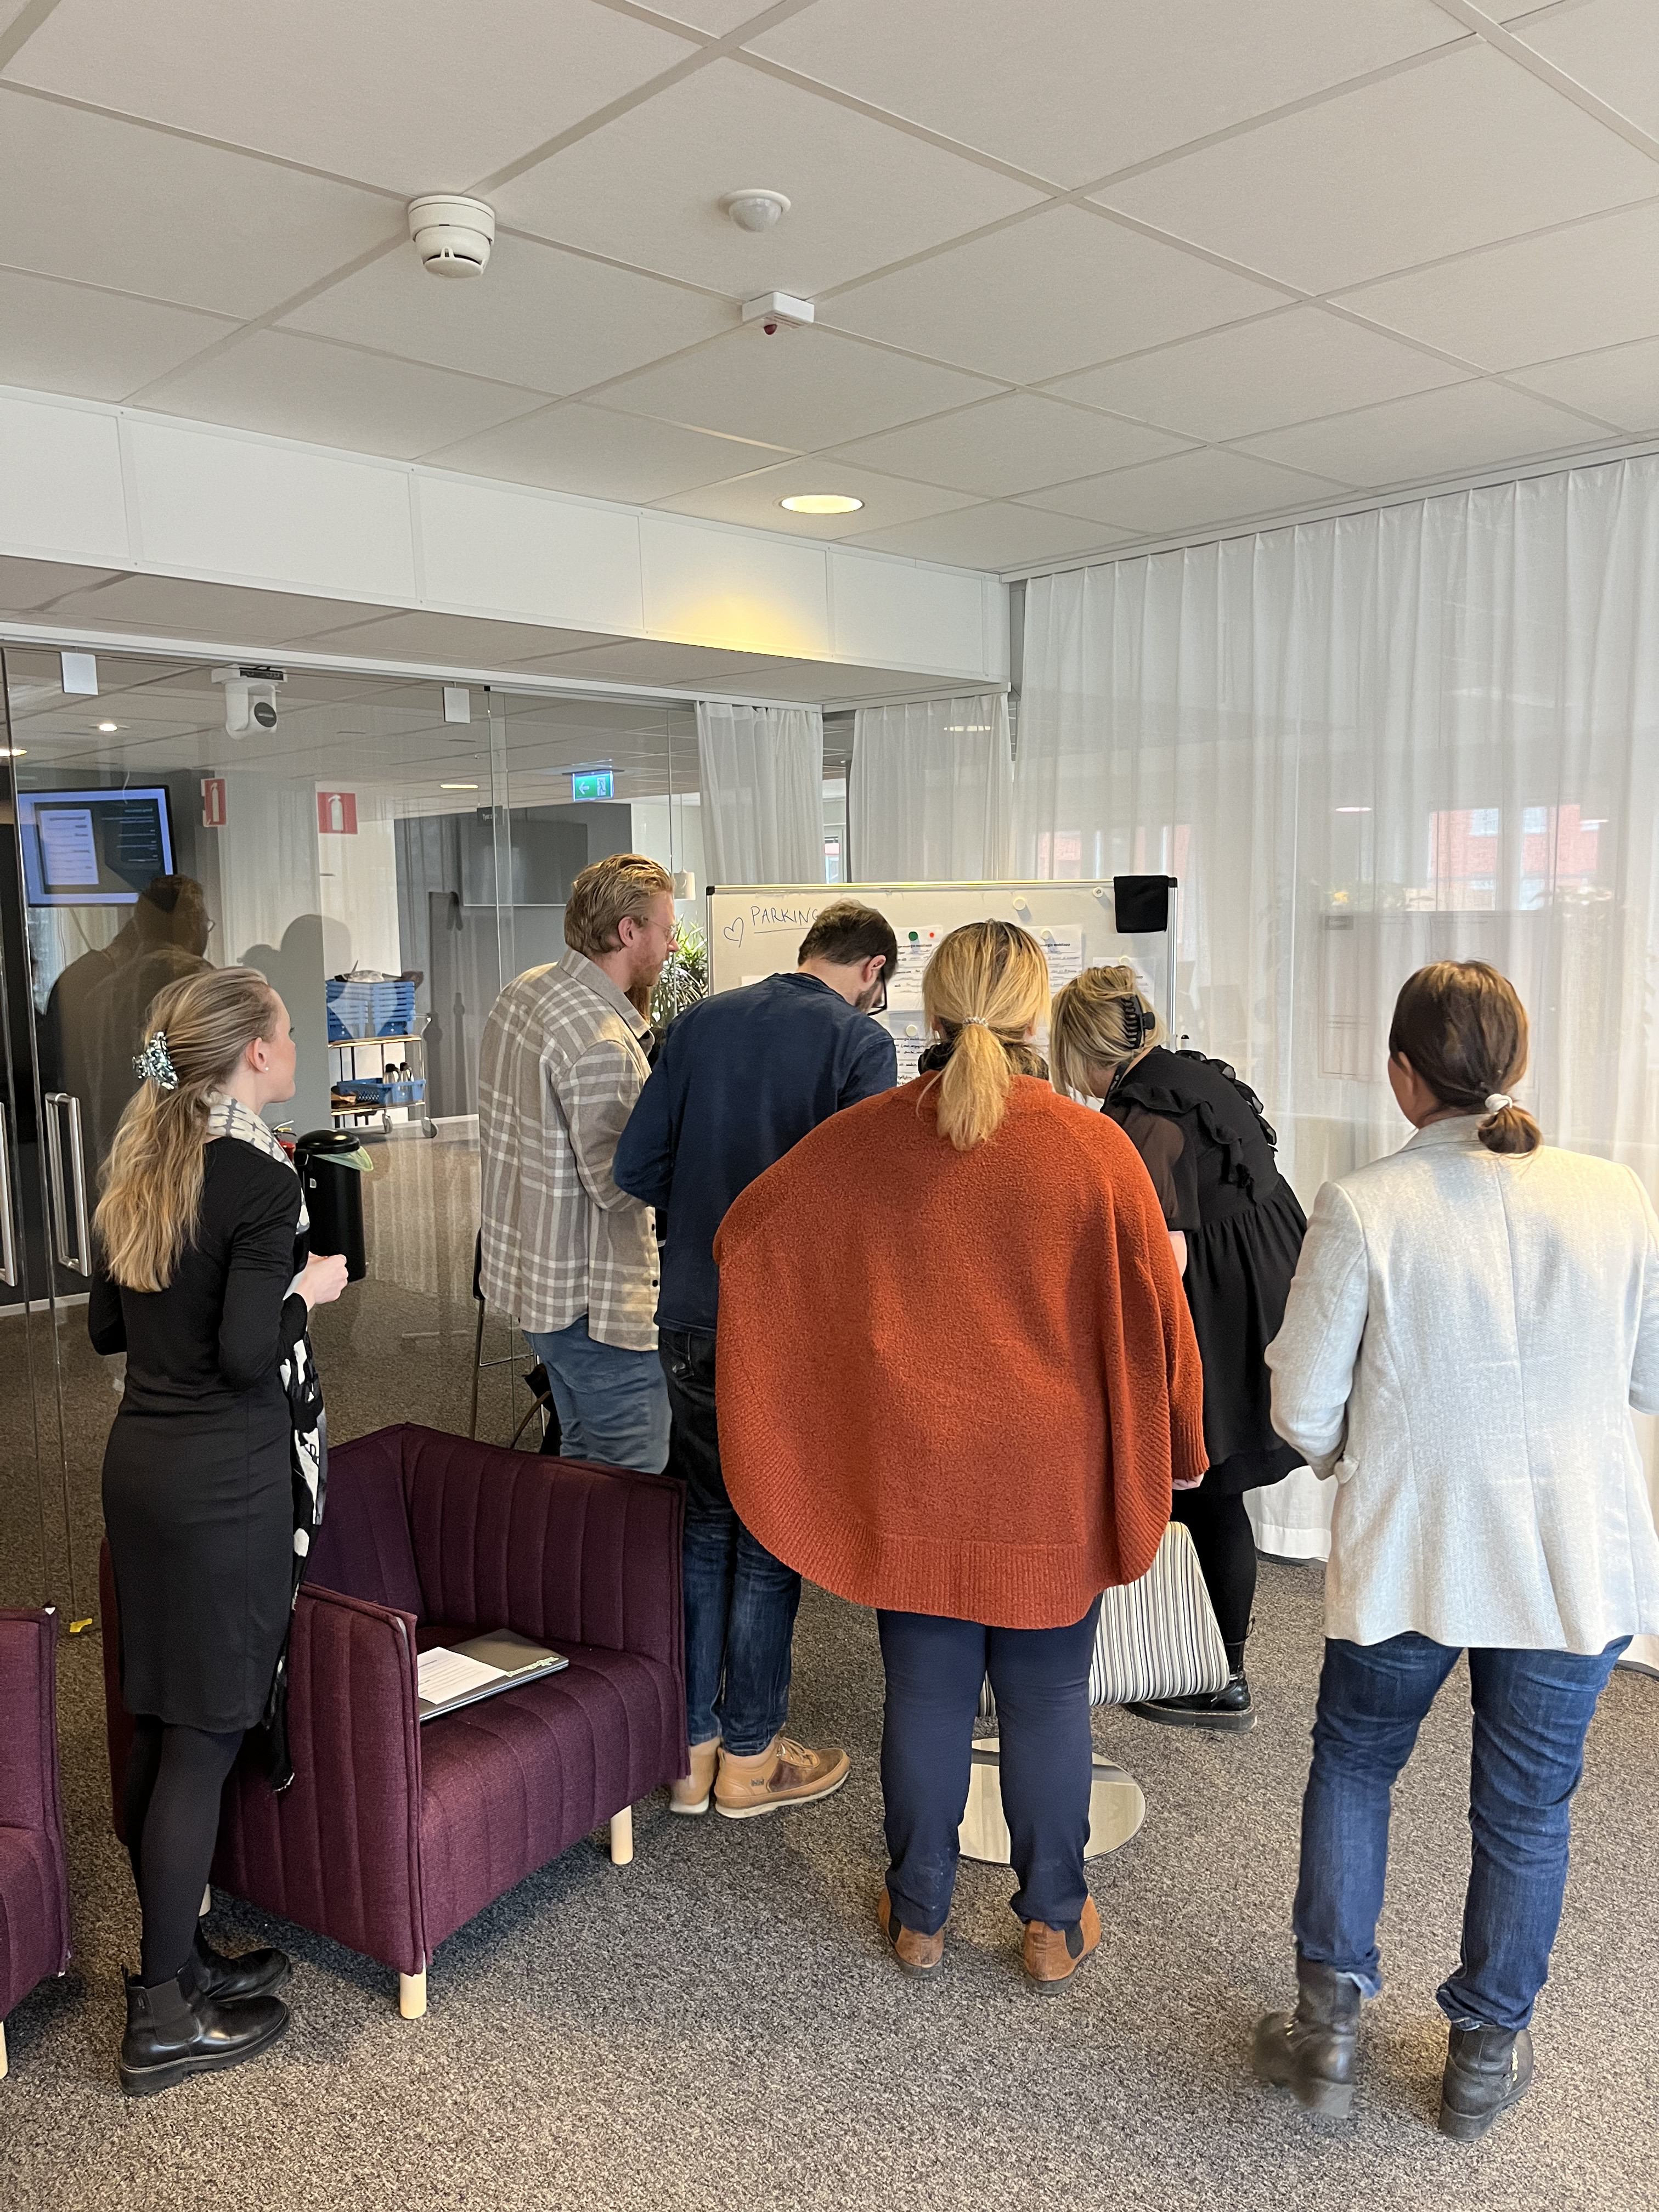
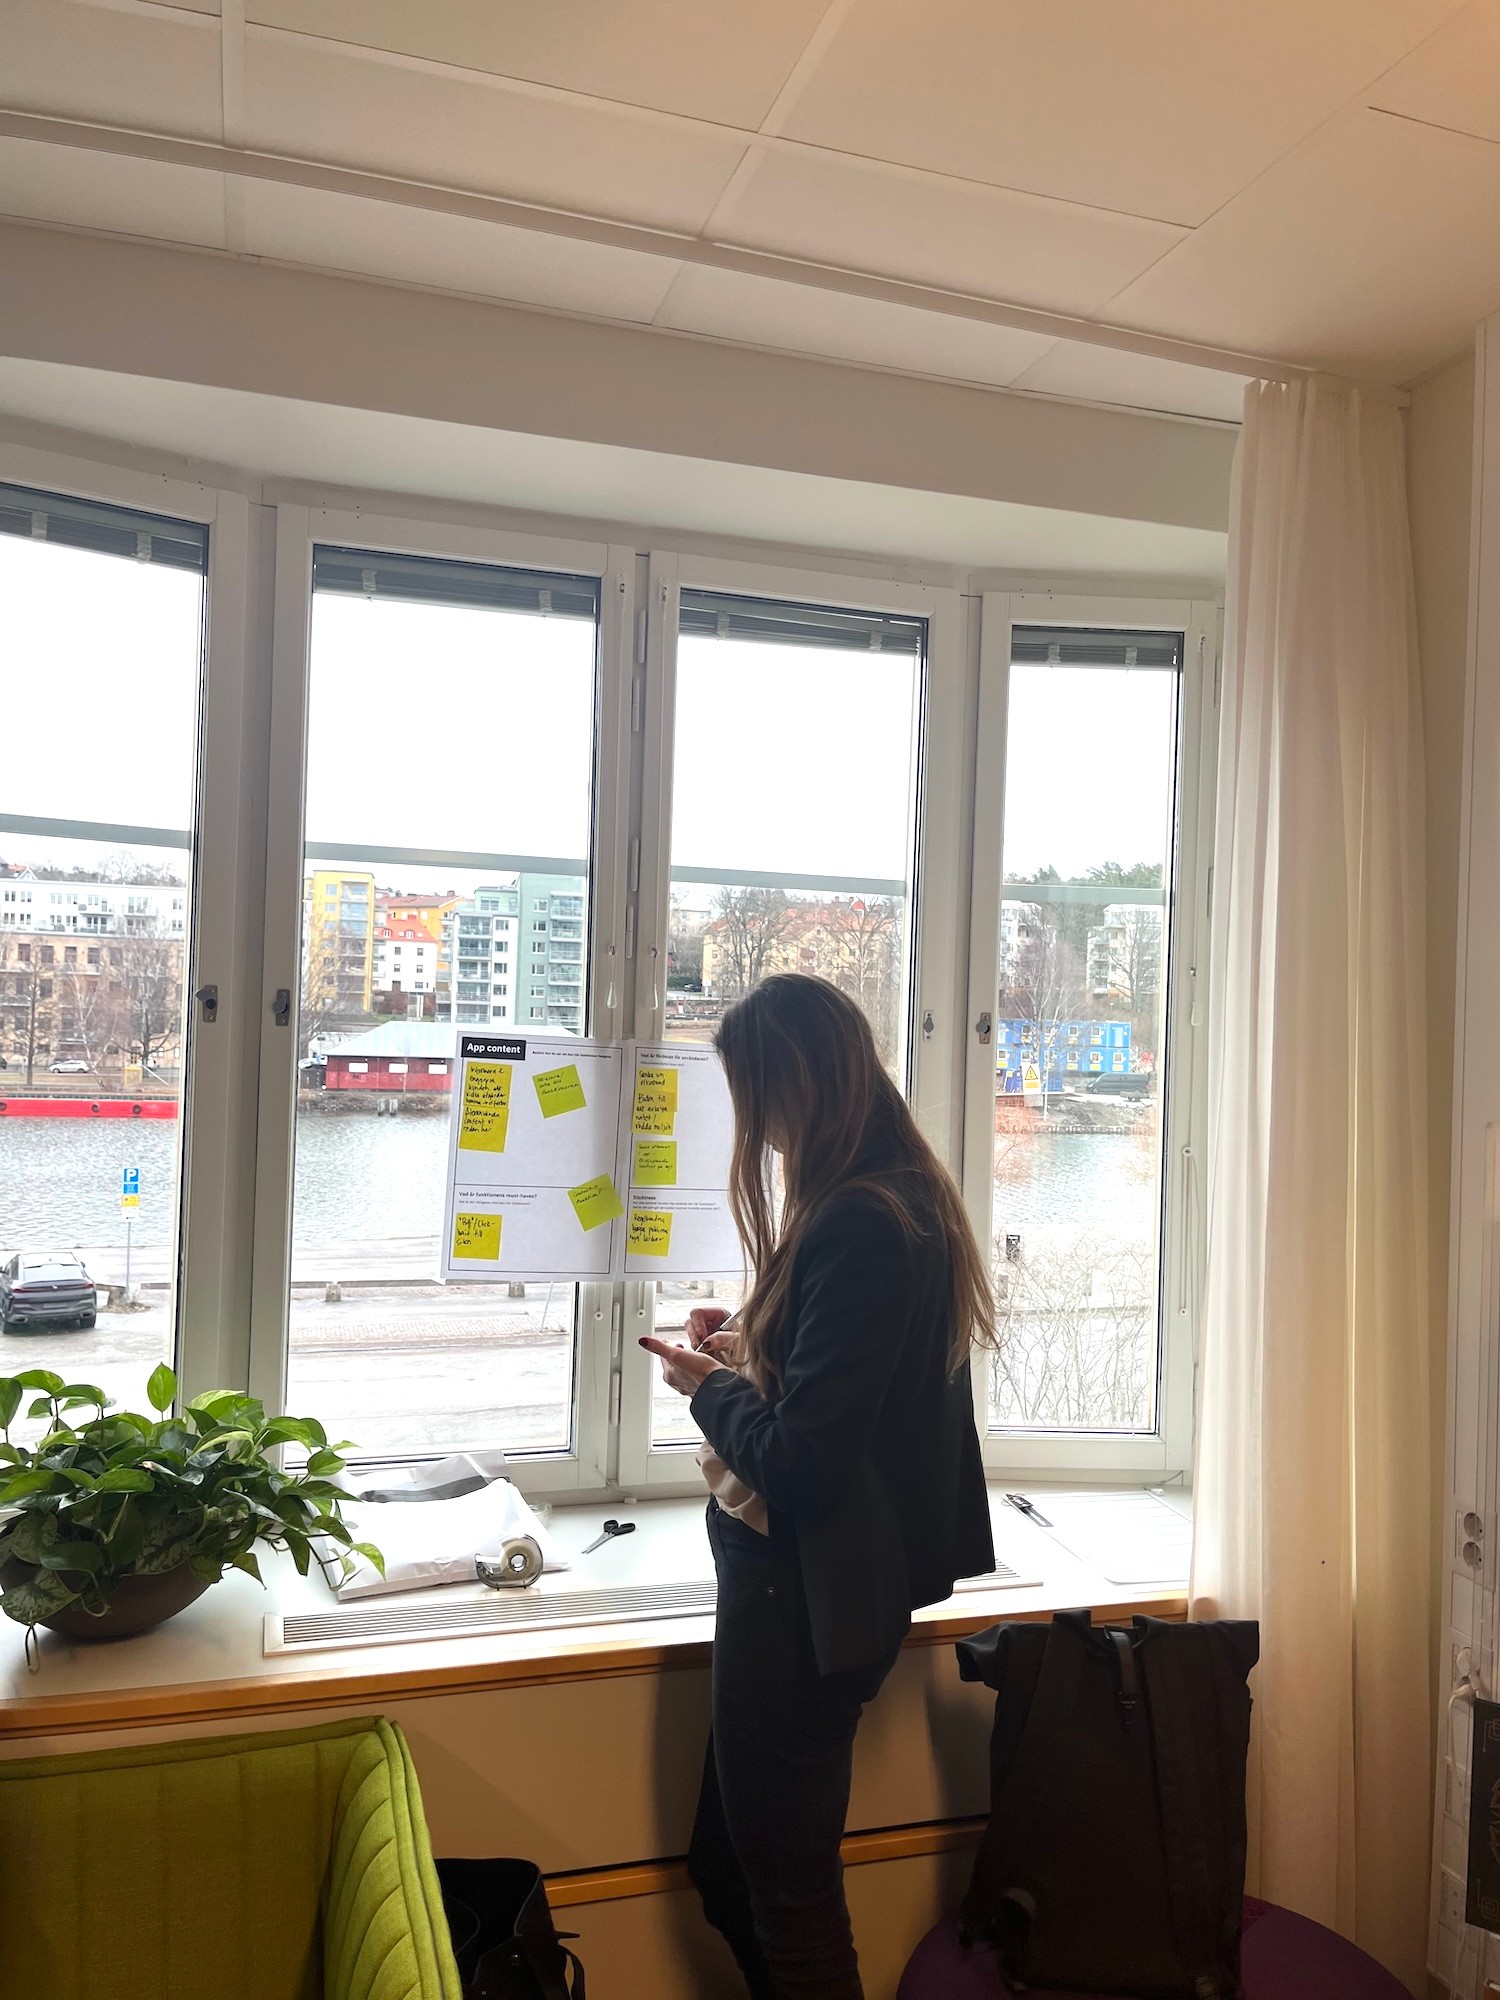
We started our work with Telge in a session to align on the vision for the app. I defined and facilitated the workshop, collecting stakeholders from across the business and bringing in feedback from users, to come together and create the vision for the app, and the must-have’s for the MVP.
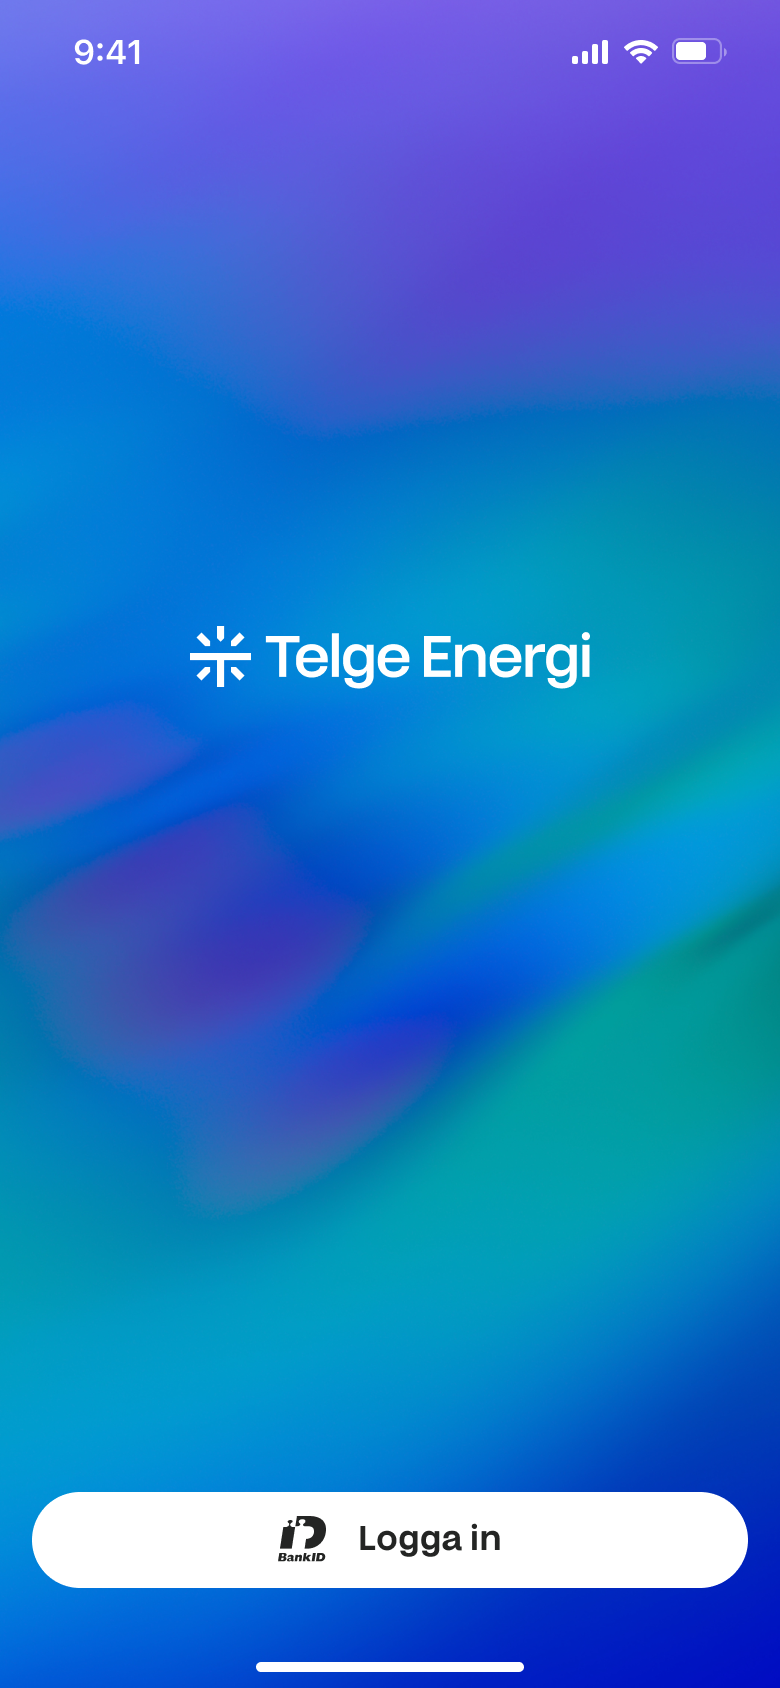
Applying a new brand
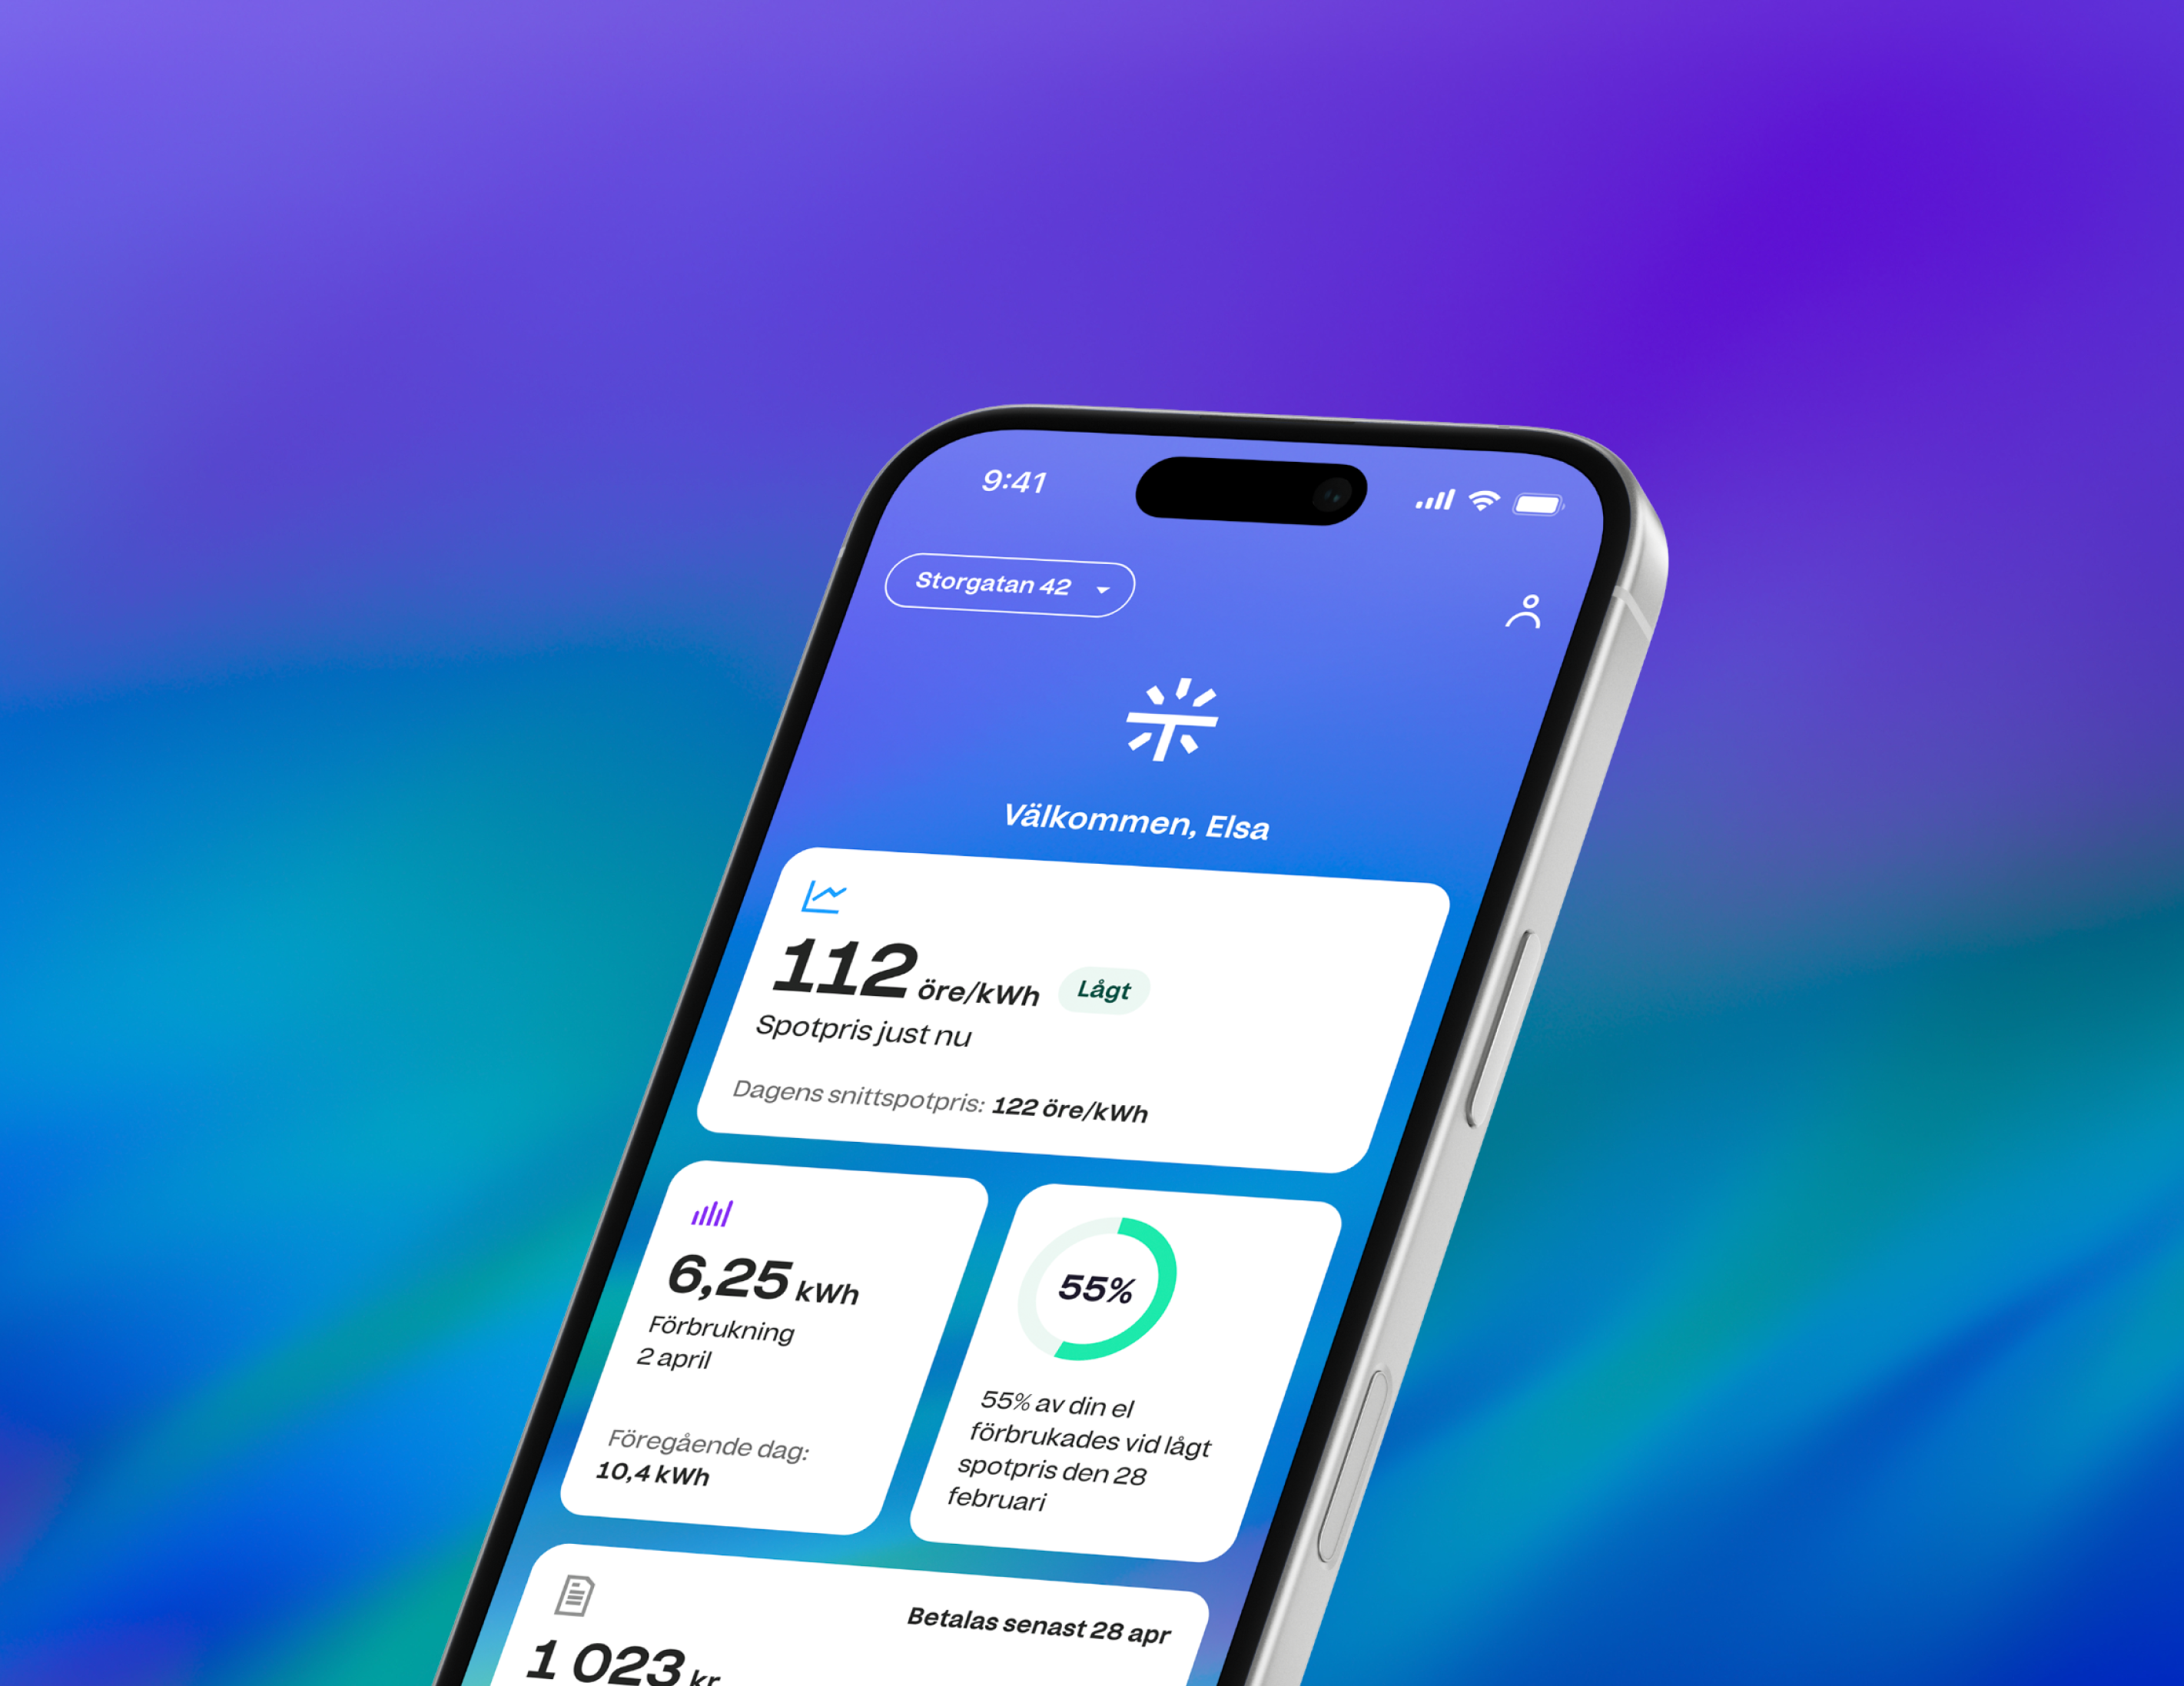
We knew from the start that the app would be data and graph heavy, so the home tab was really the key place to apply more brand personality. Telge had just gotten a new brand identity done by Söderhavet and this was the first time it would be implemented in one of their digital products.
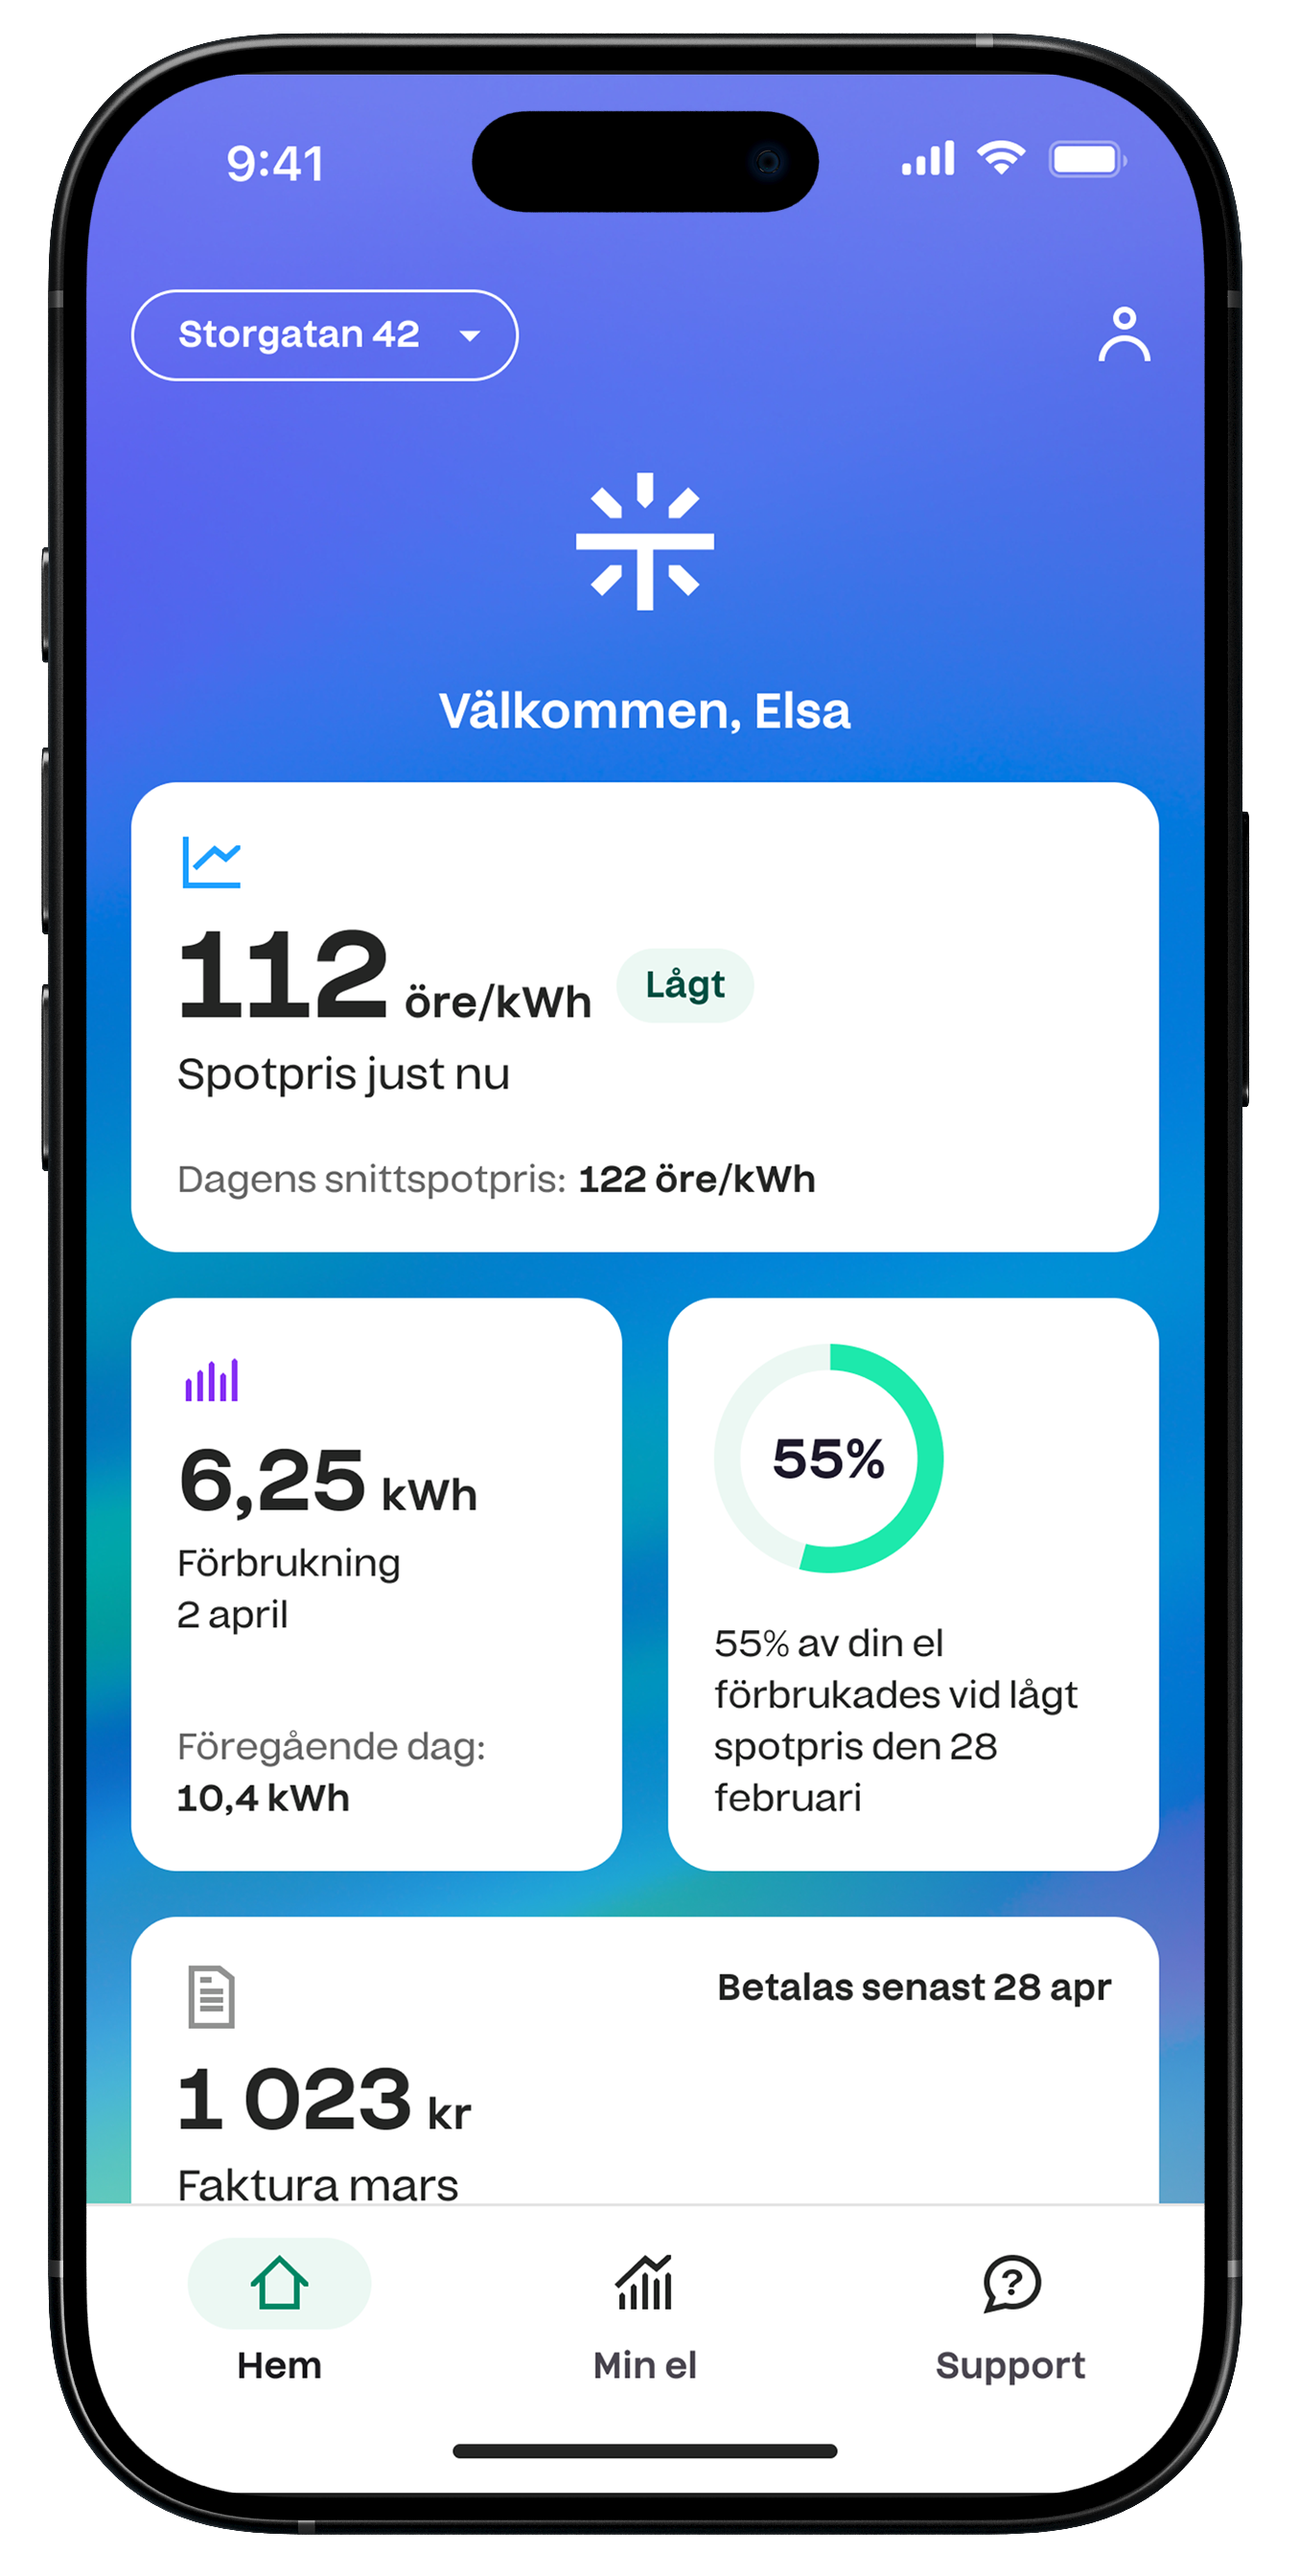
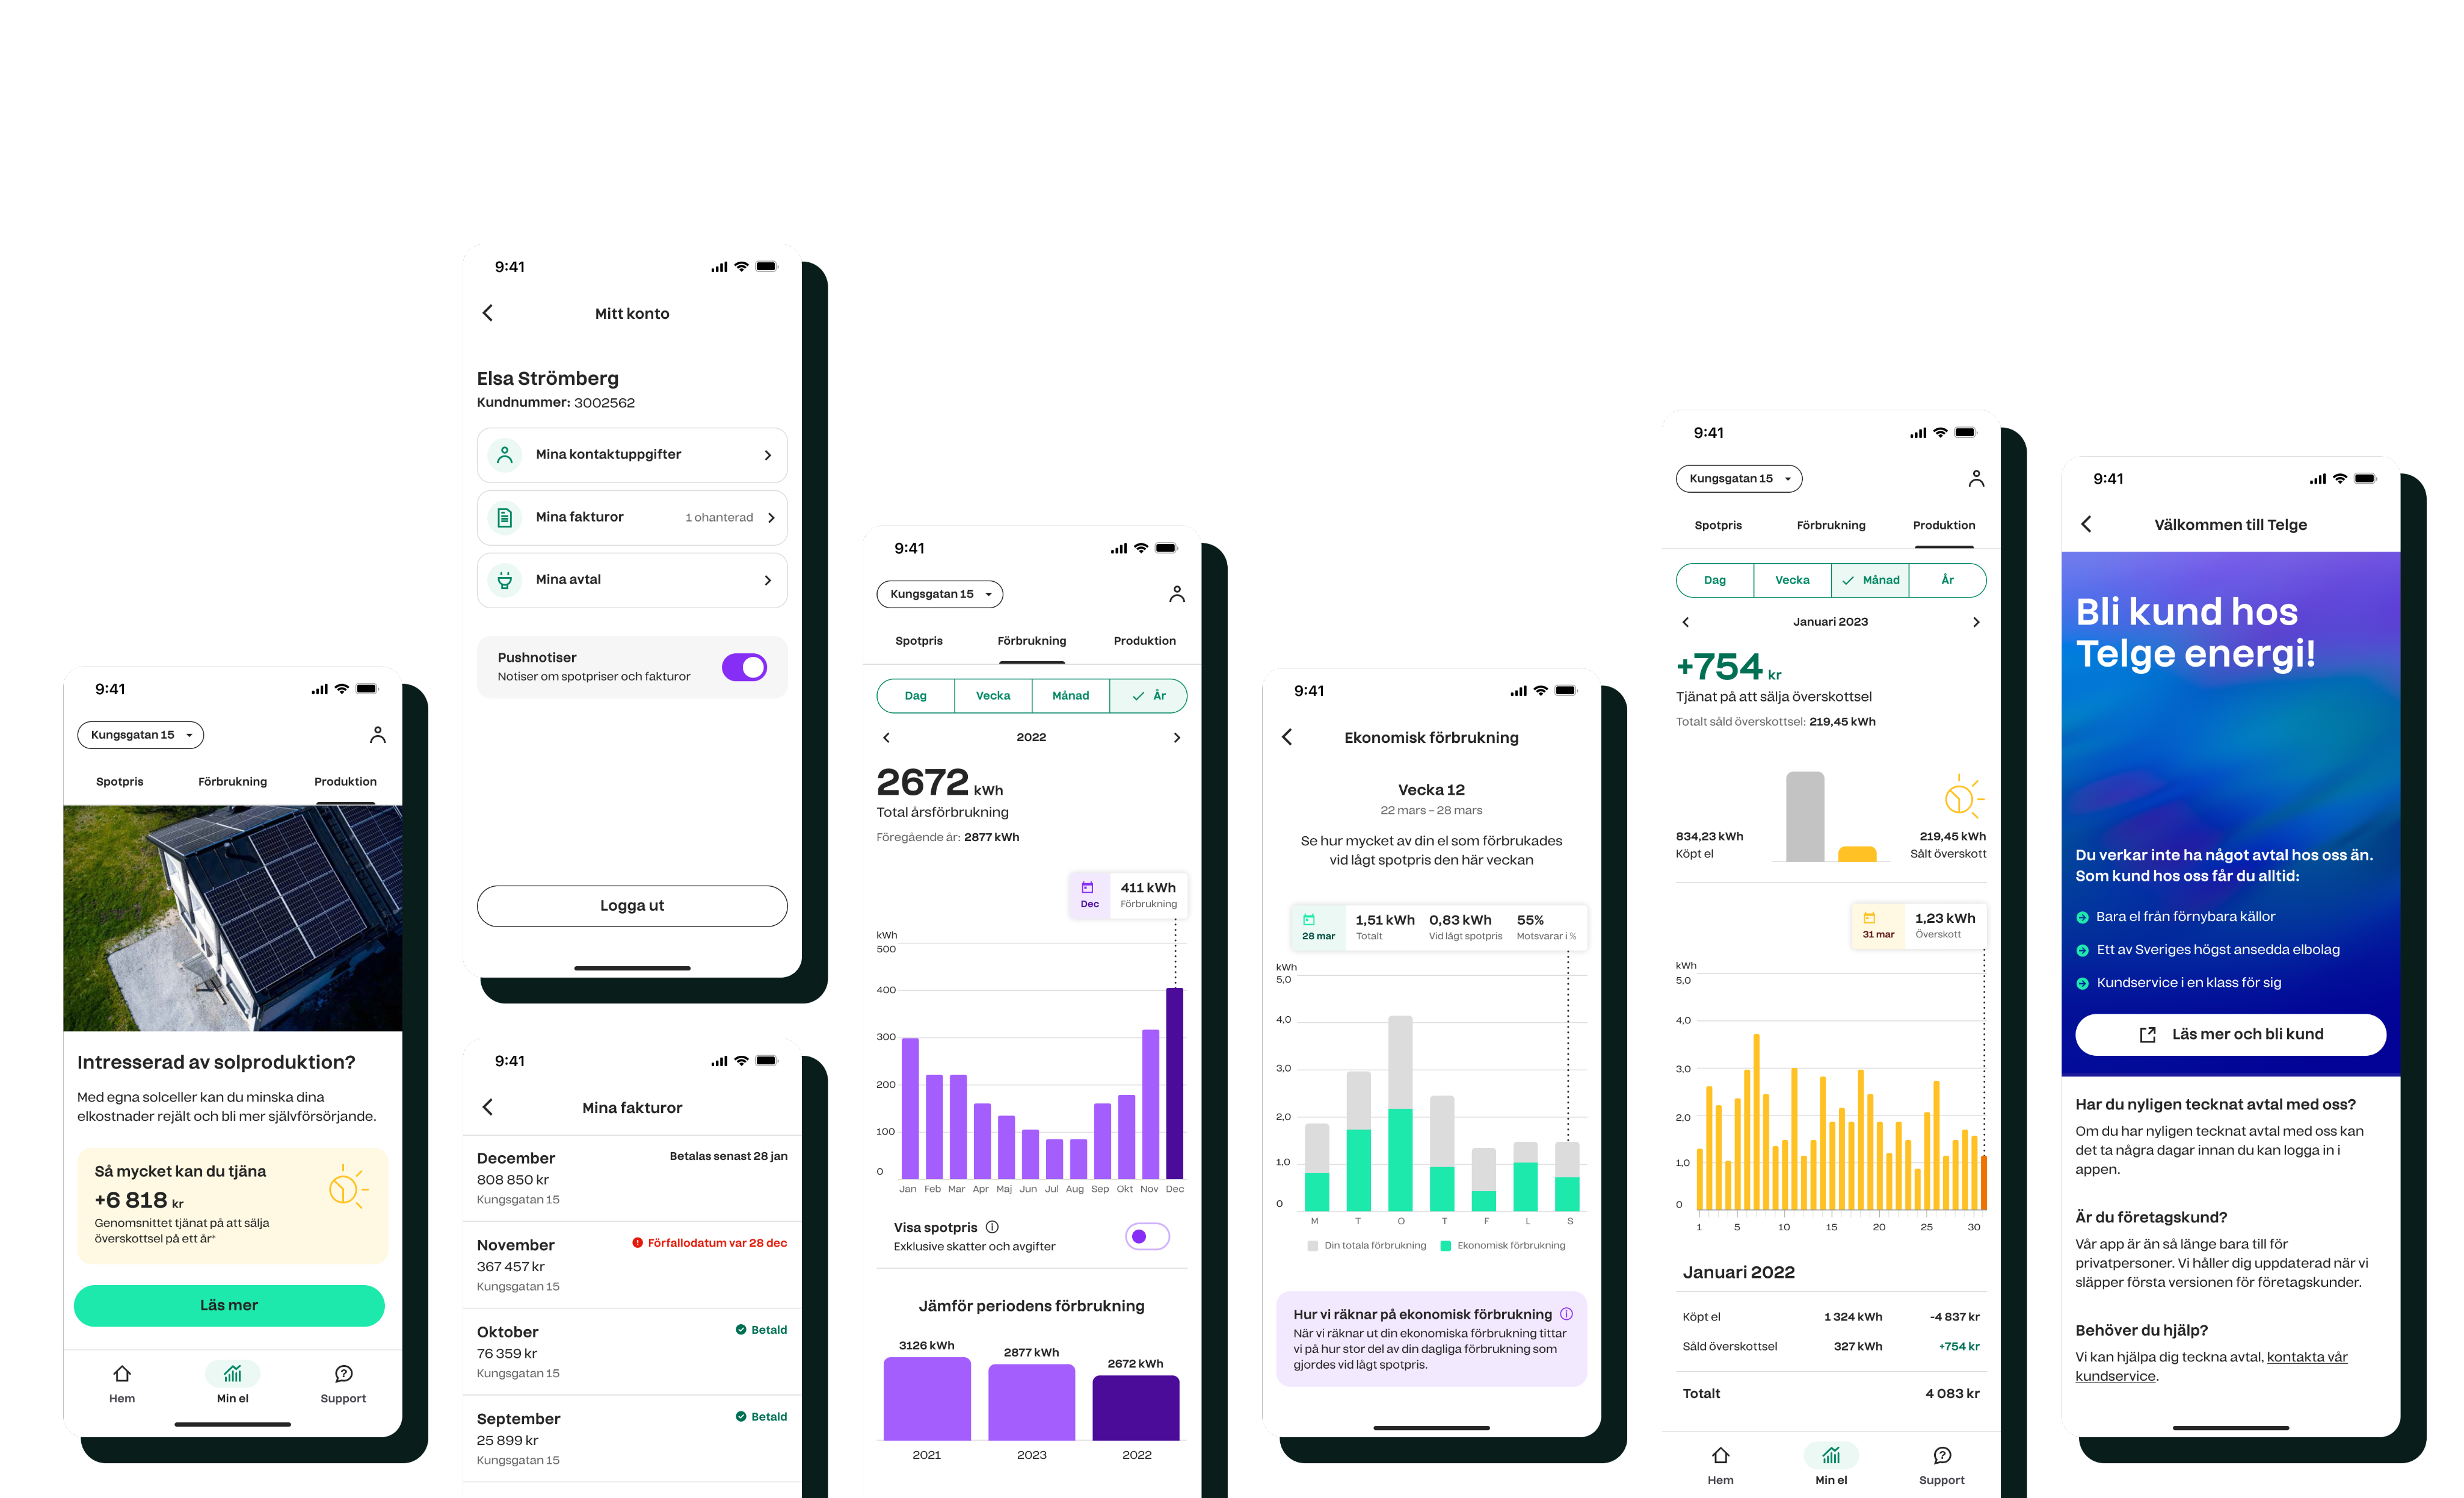
After some exploration, I settled on a bento-style grid to be able to give an overview of key data, while simultaneously bringing in the branded background.

Creating a design system
Part of my work was applying the new brand to digital, and building out a design system of components for the app. The app was built on the hybrid solution, Flutter, which meant the same app would be served up on both iOS and Android.
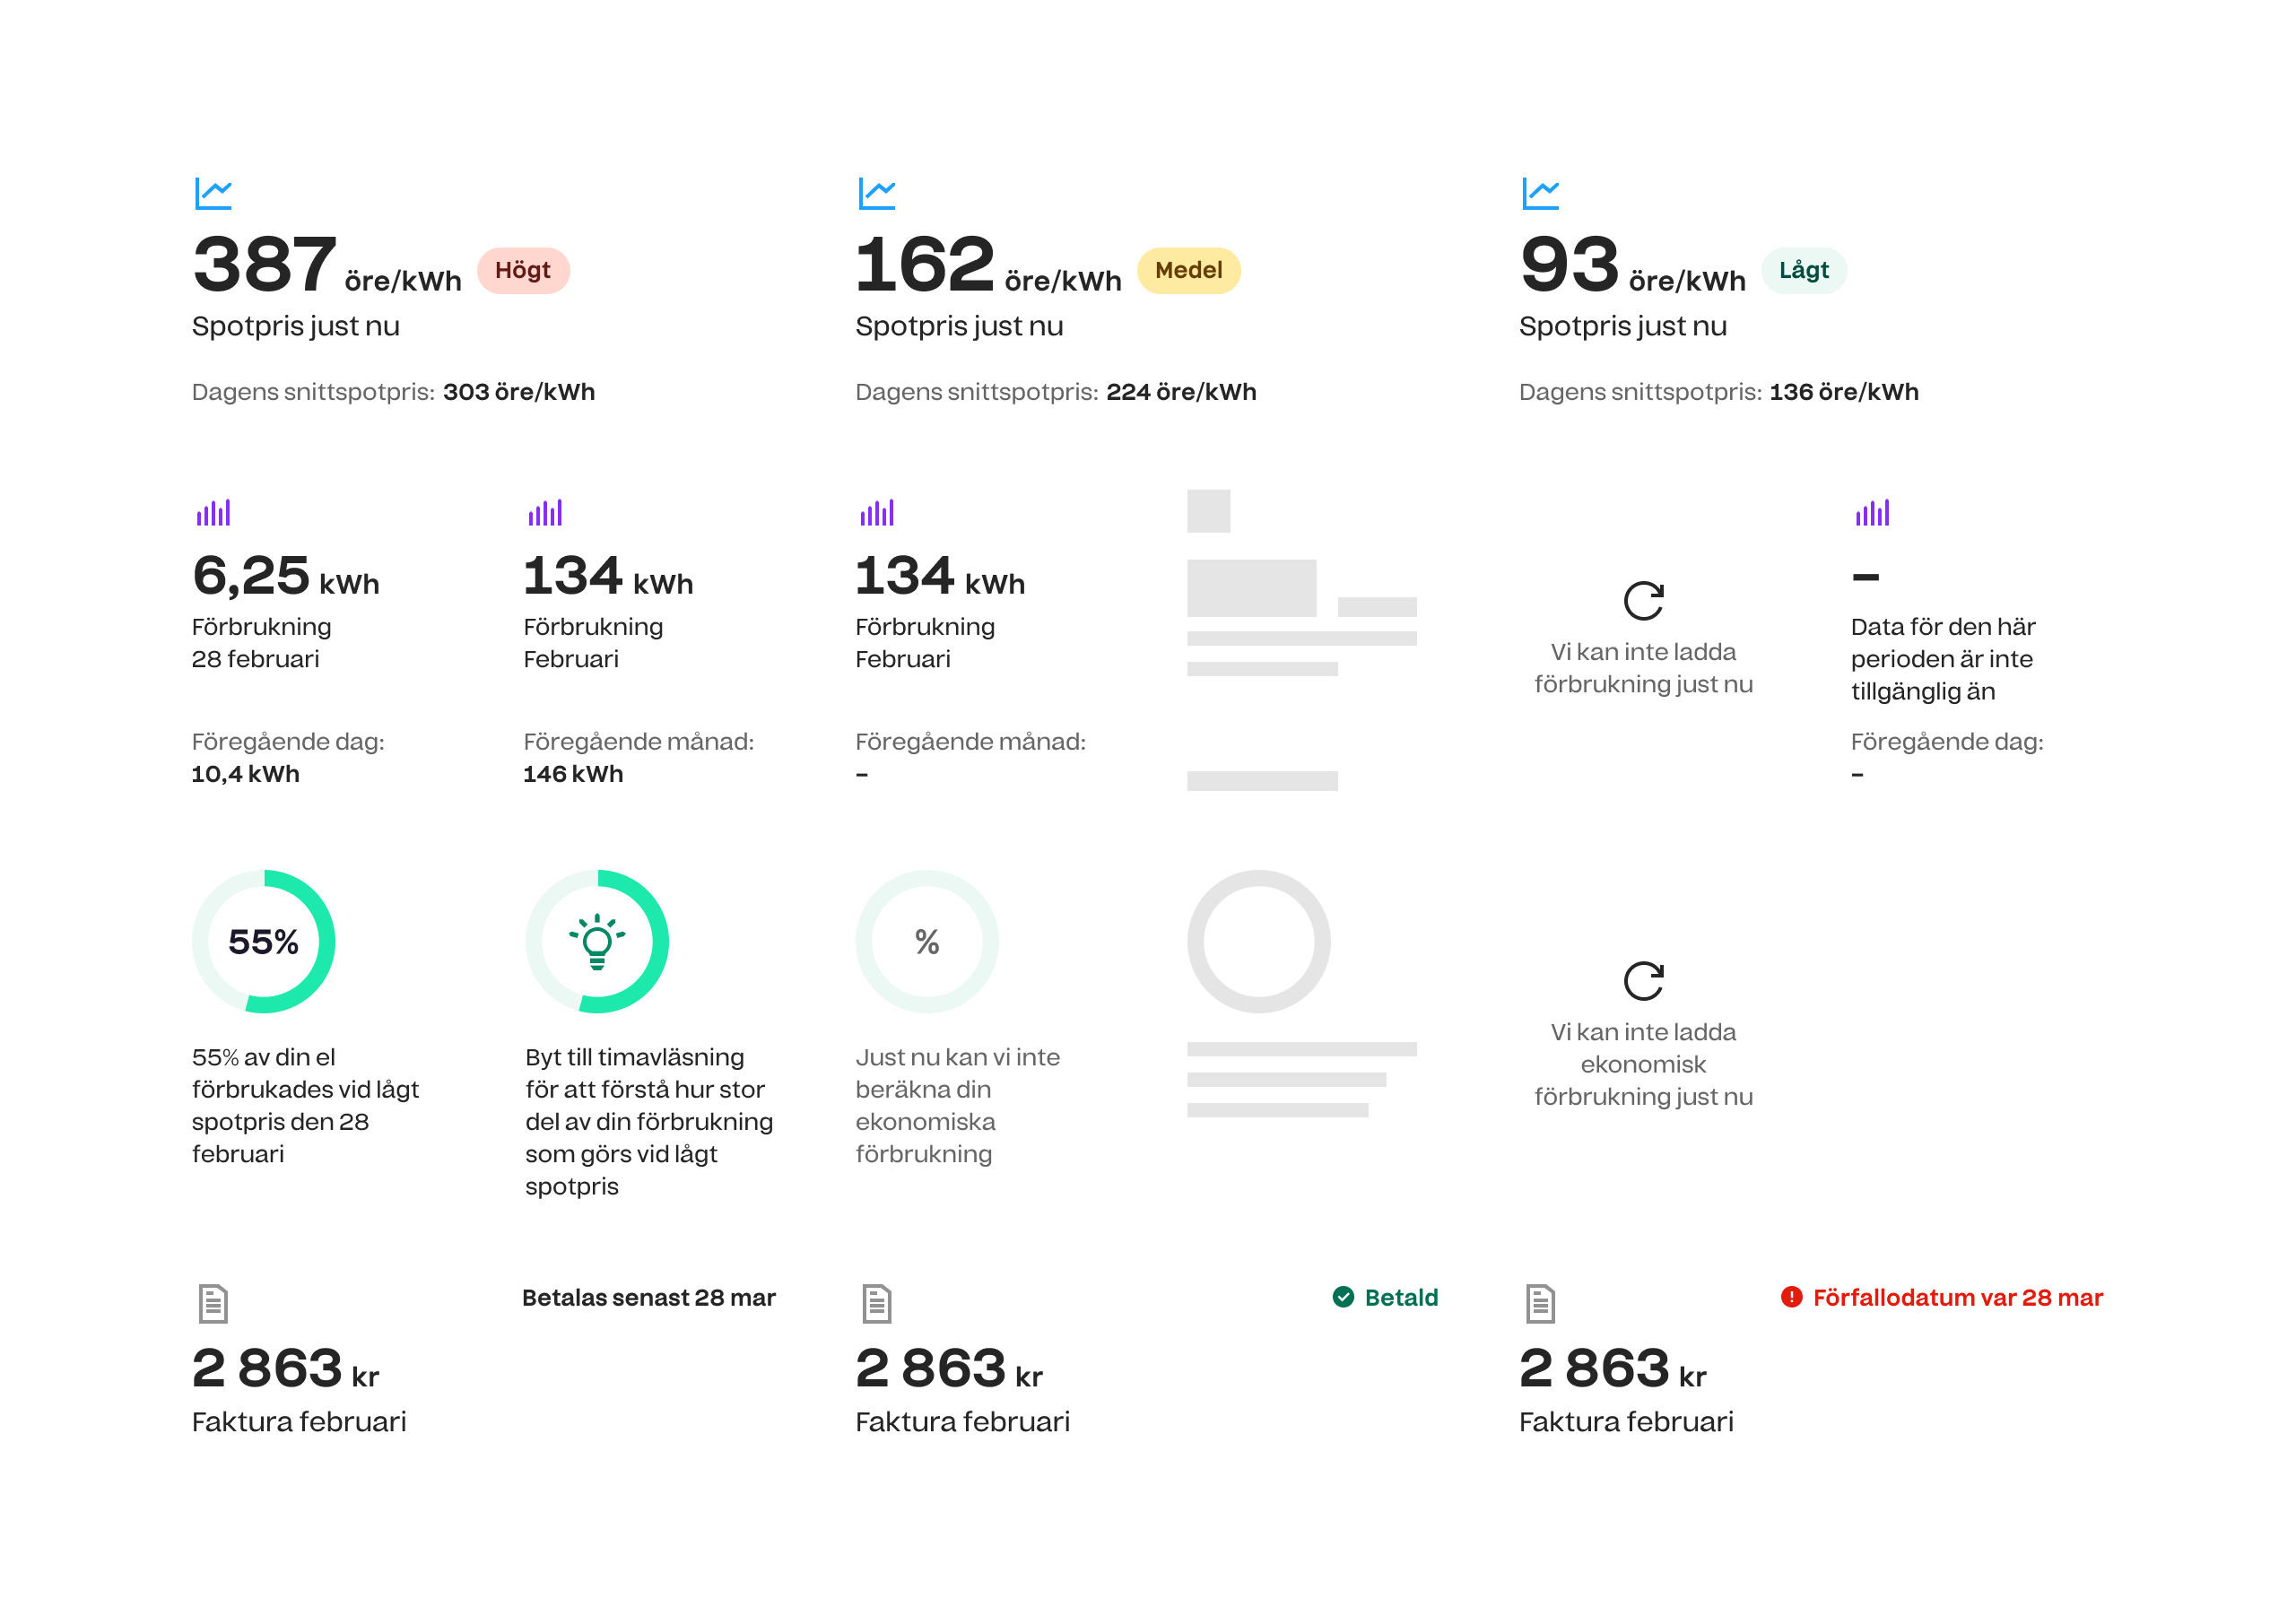

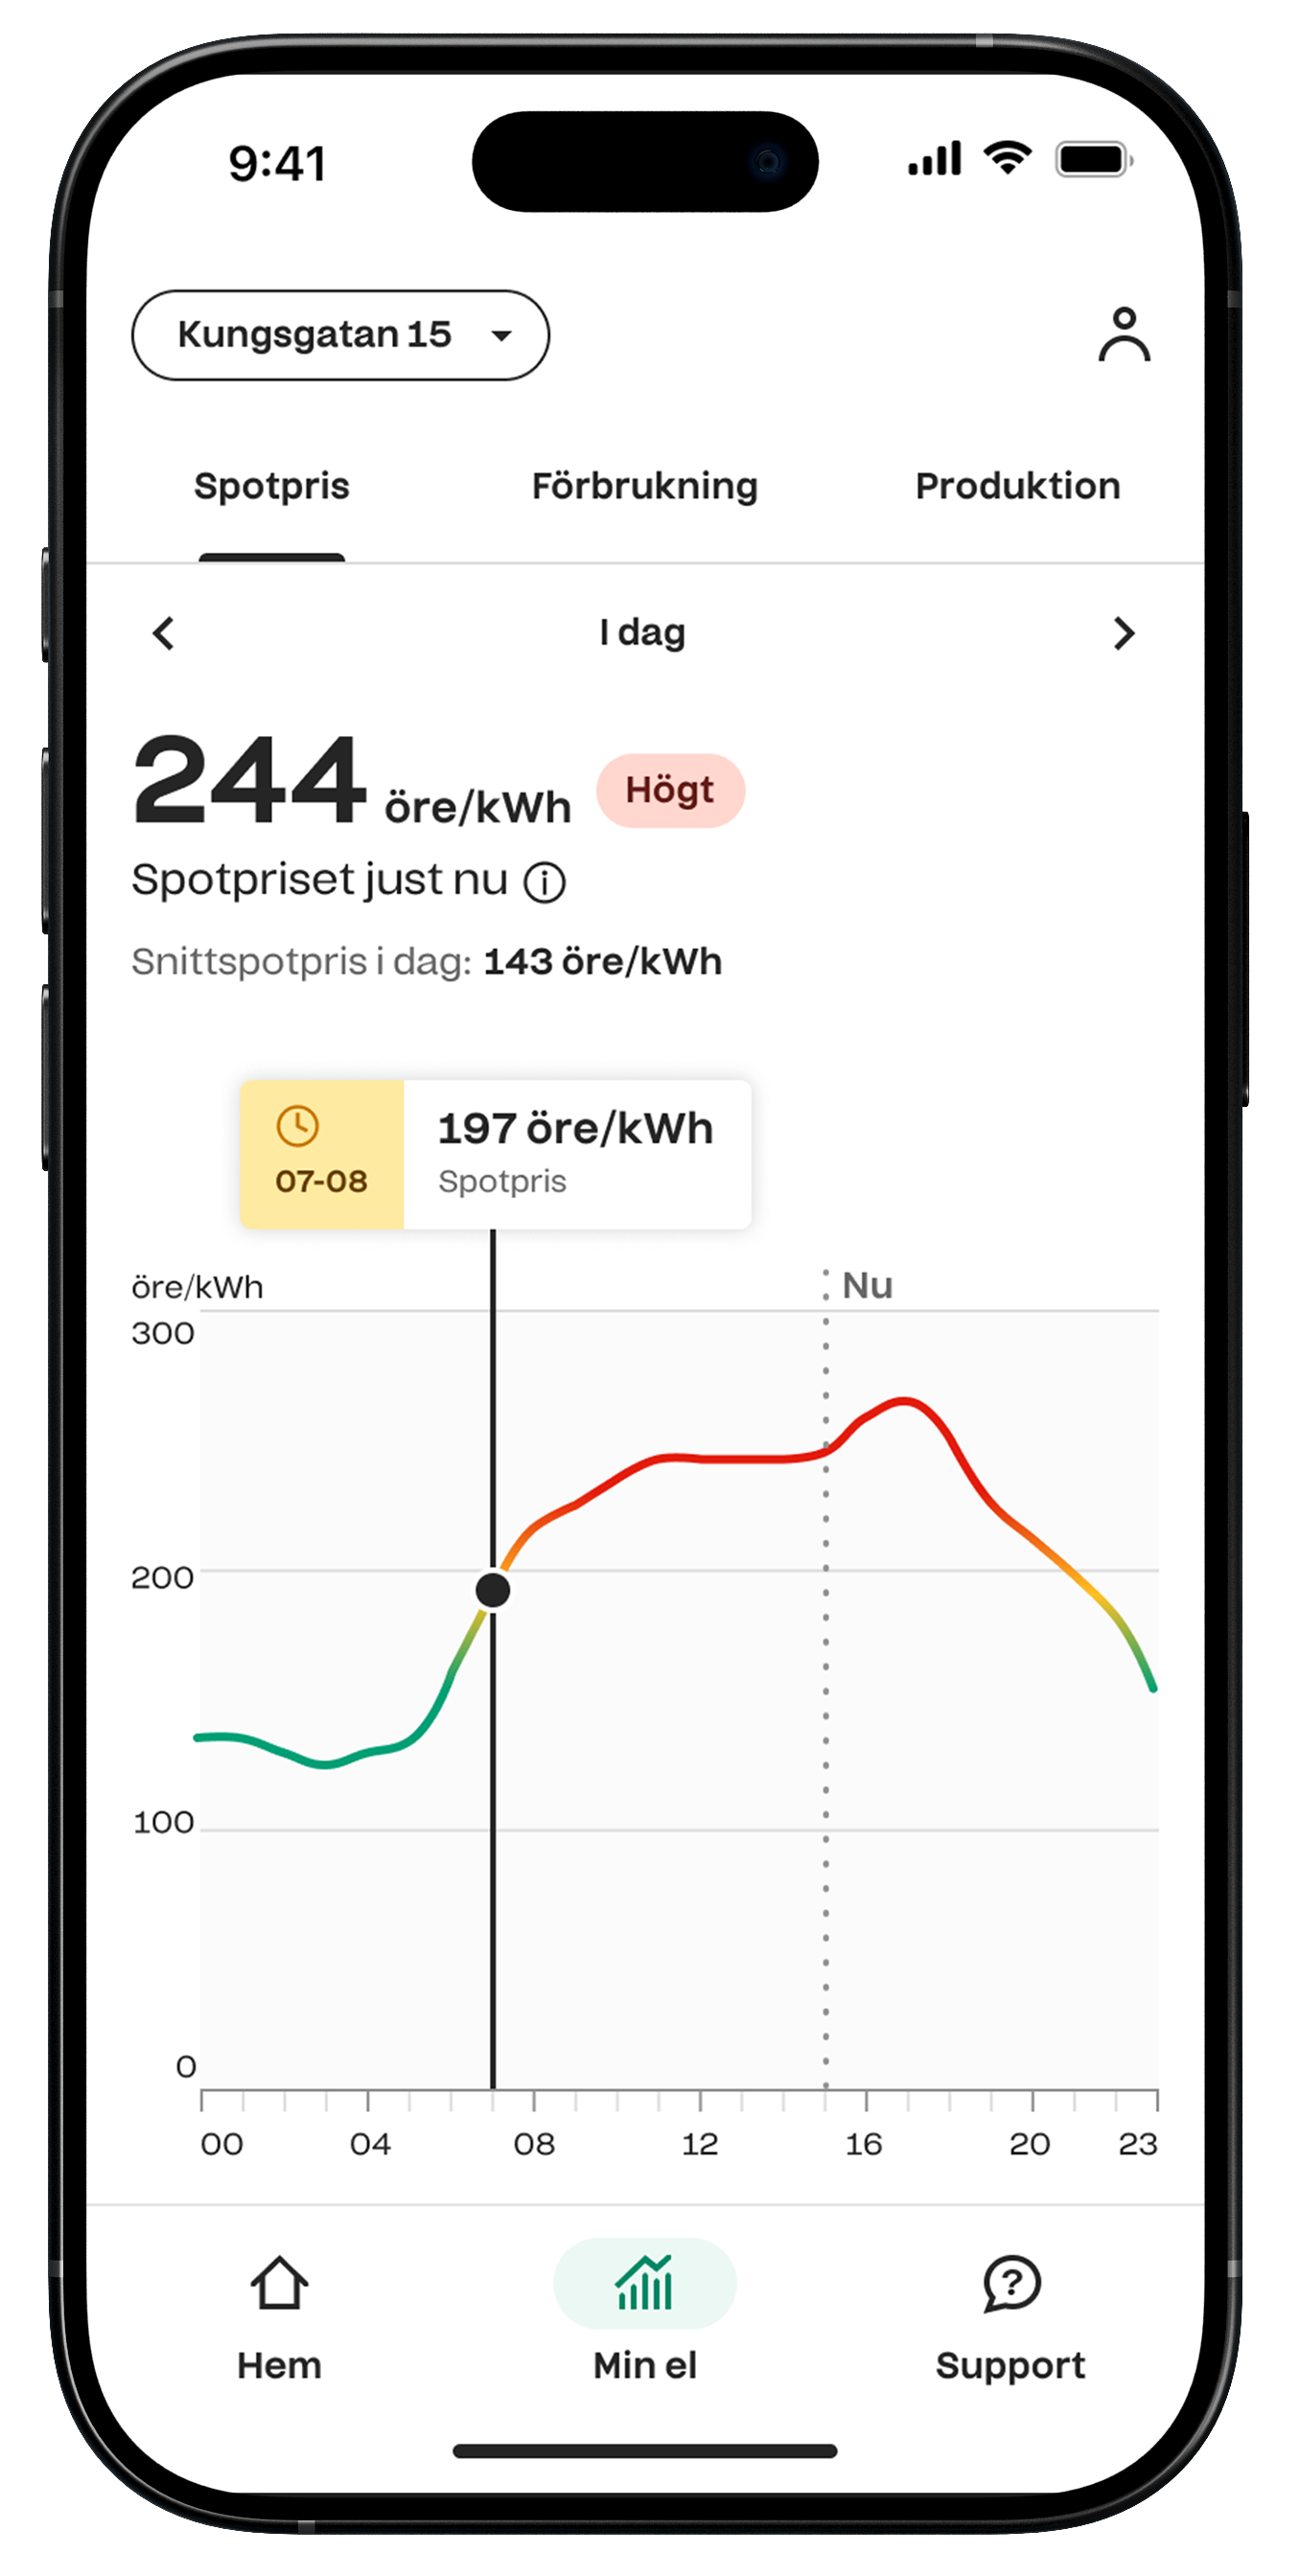
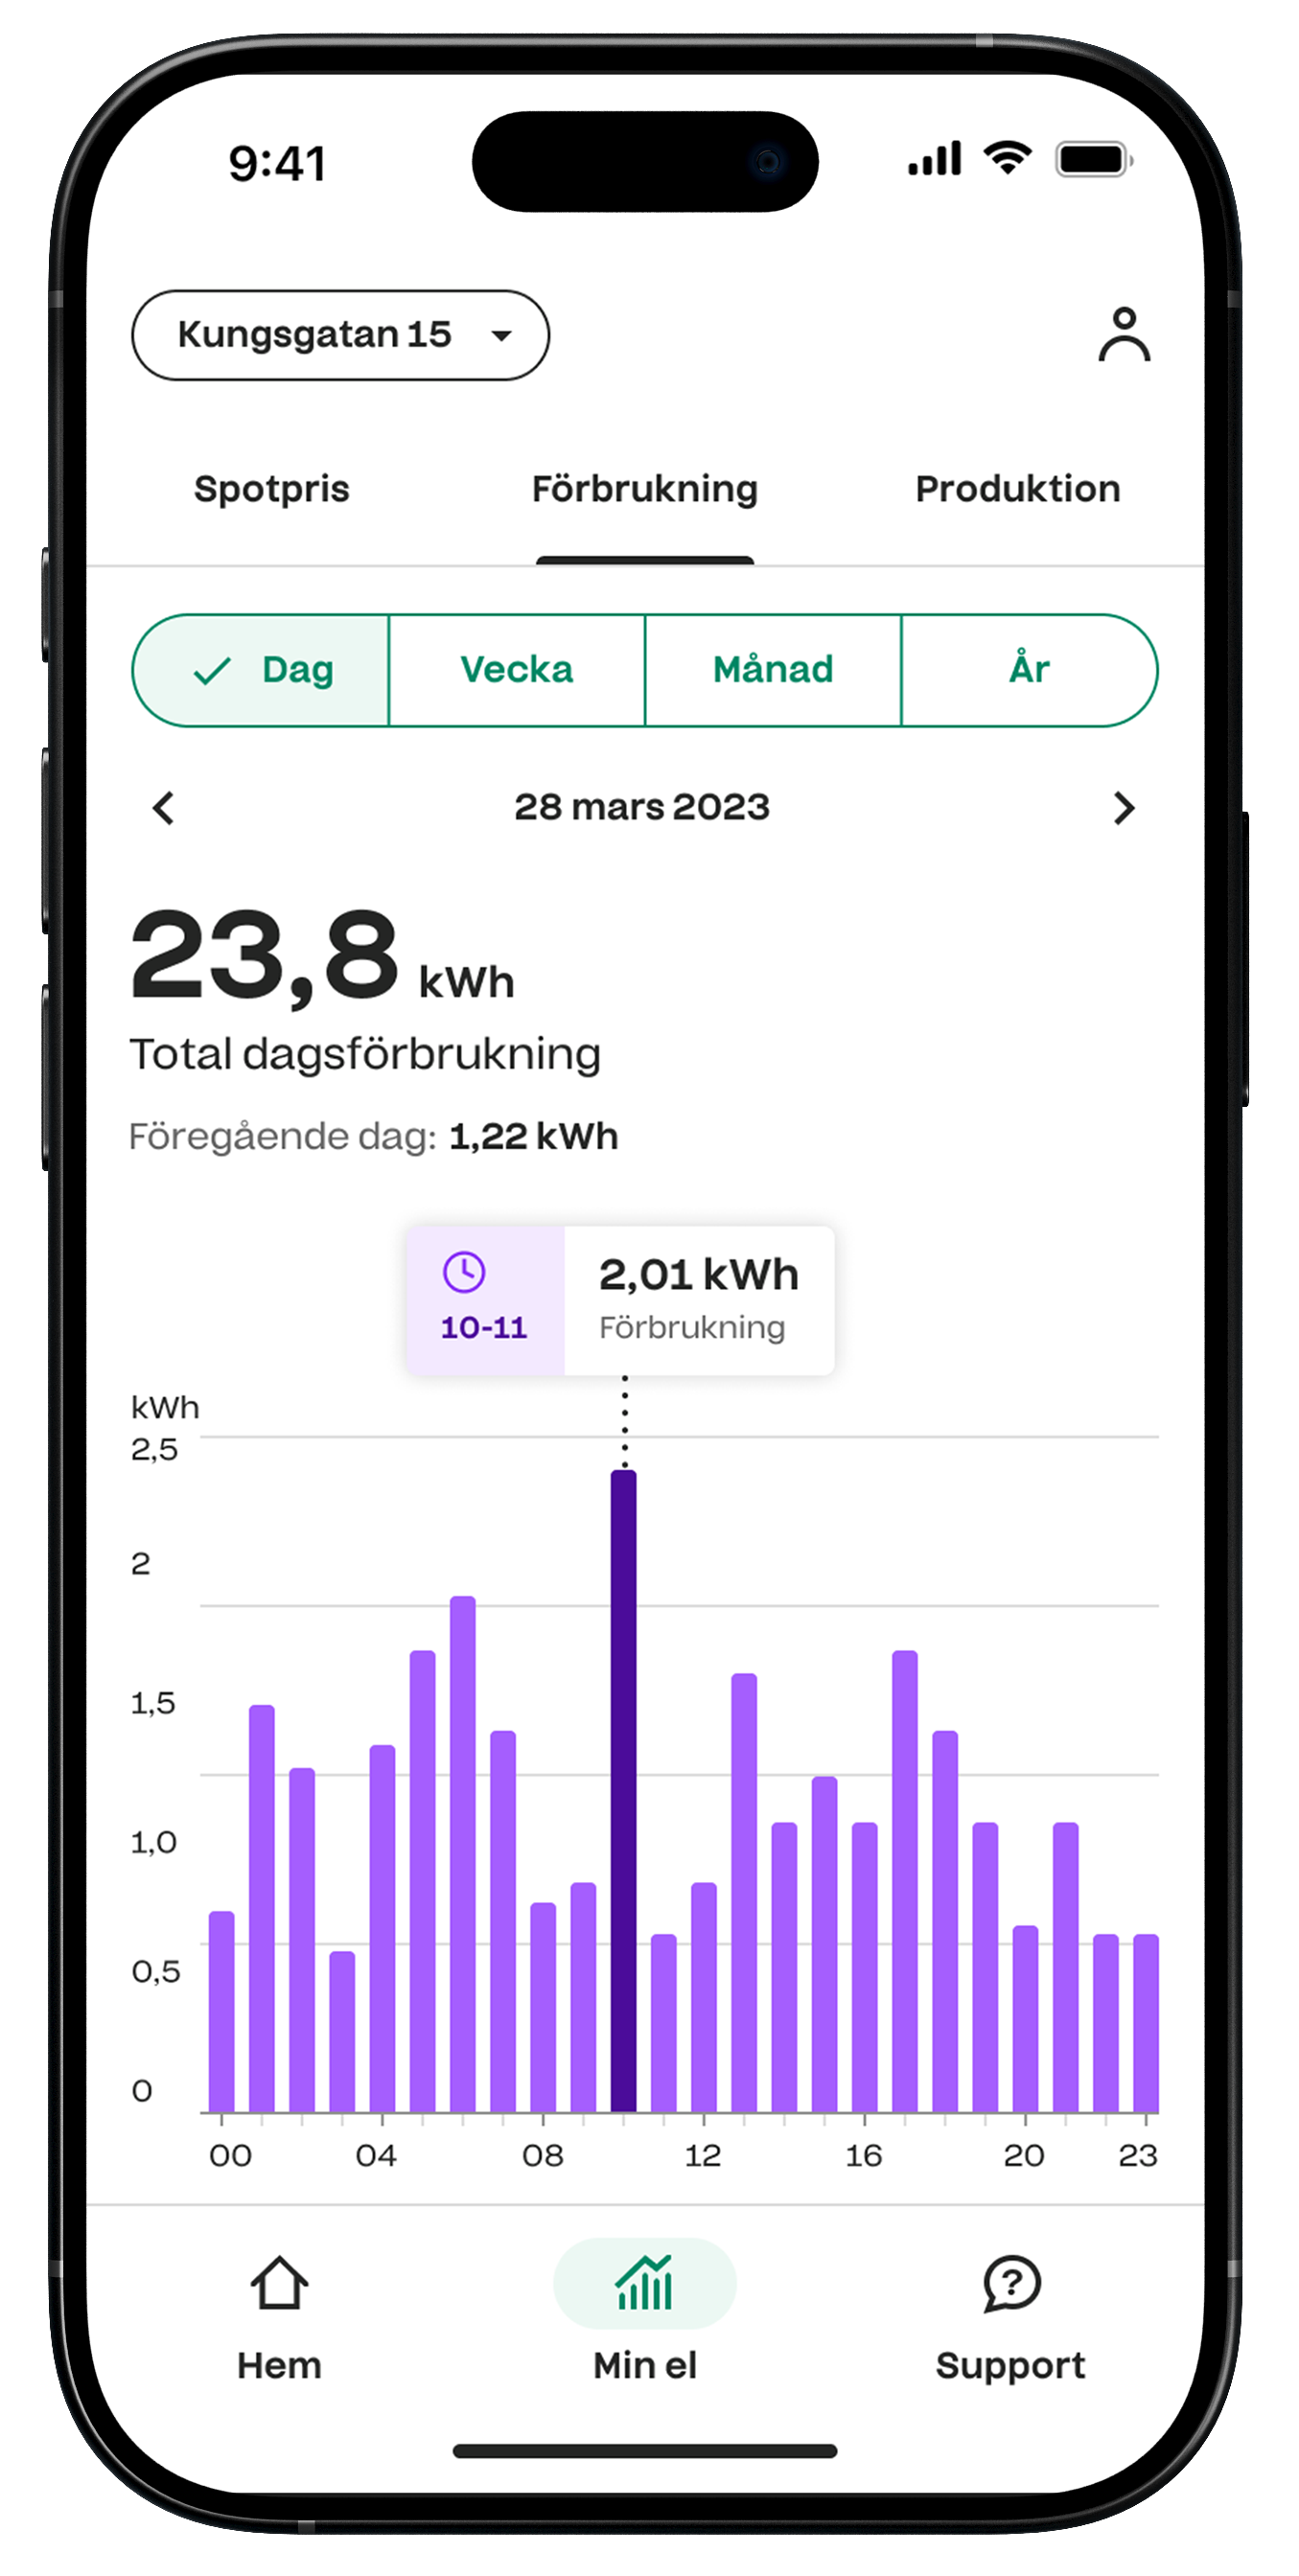
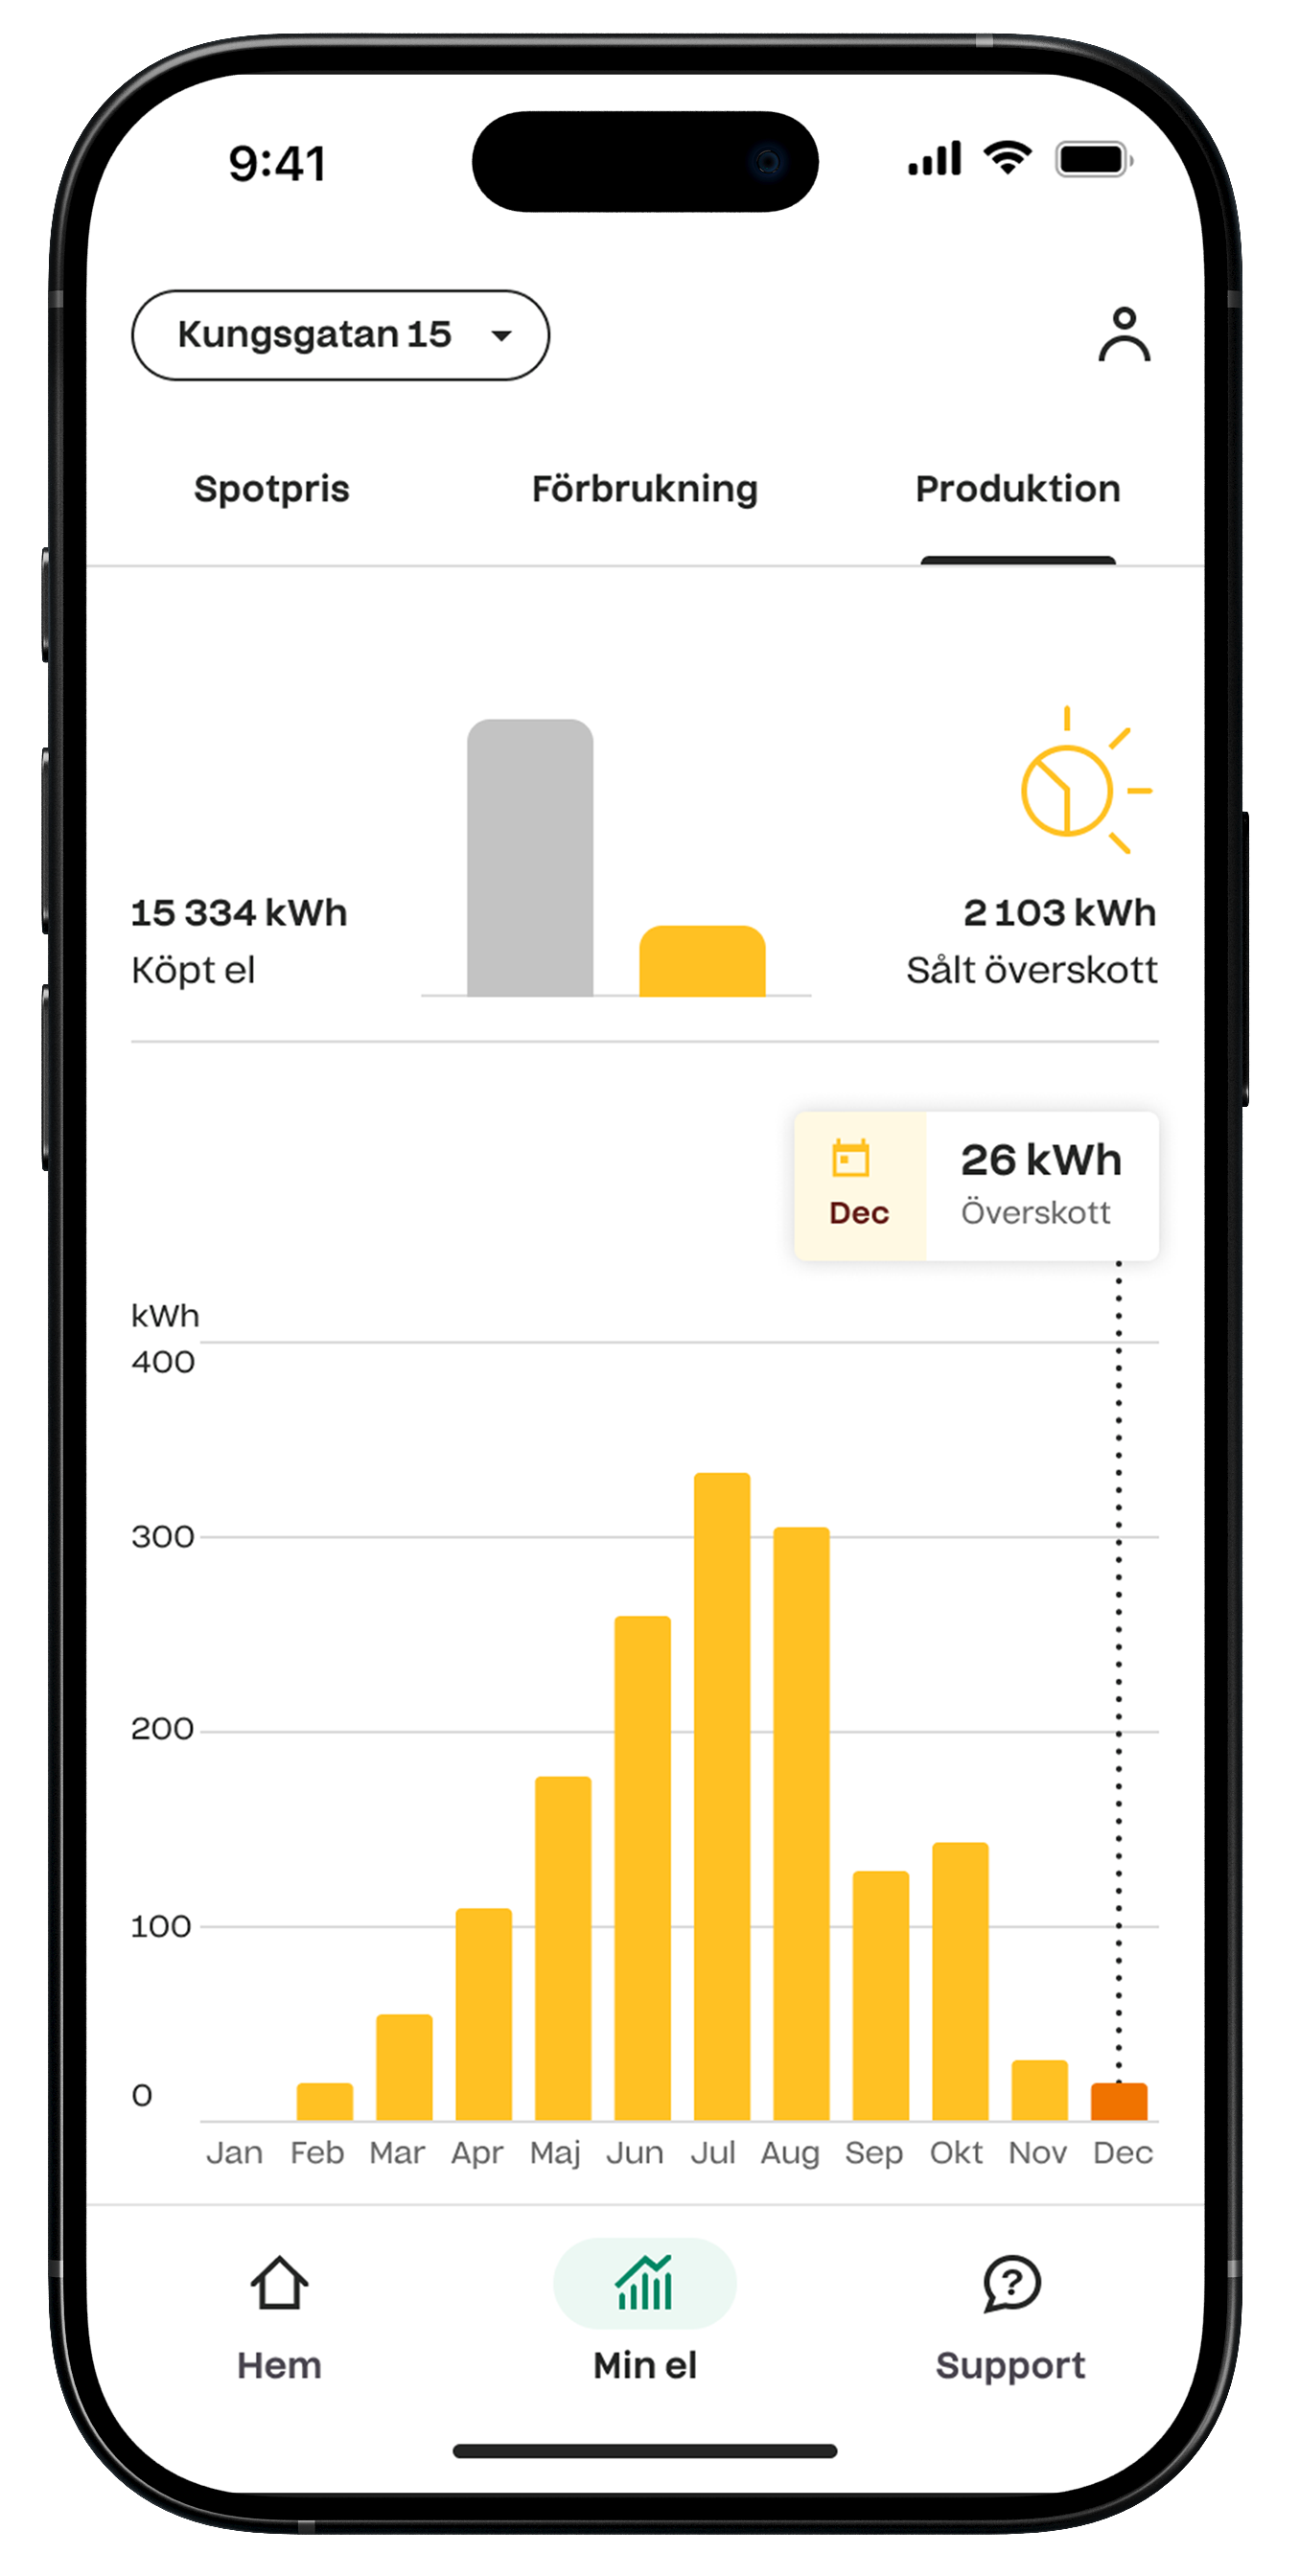
Visualizing data
Visualizing data was the key purpose of the app. Making sure the data was easy to grasp no matter what the the spot price was that day was key. I worked closely with our developers to define how the graphs’ y-axis dynamically change to always show the best view of the data.
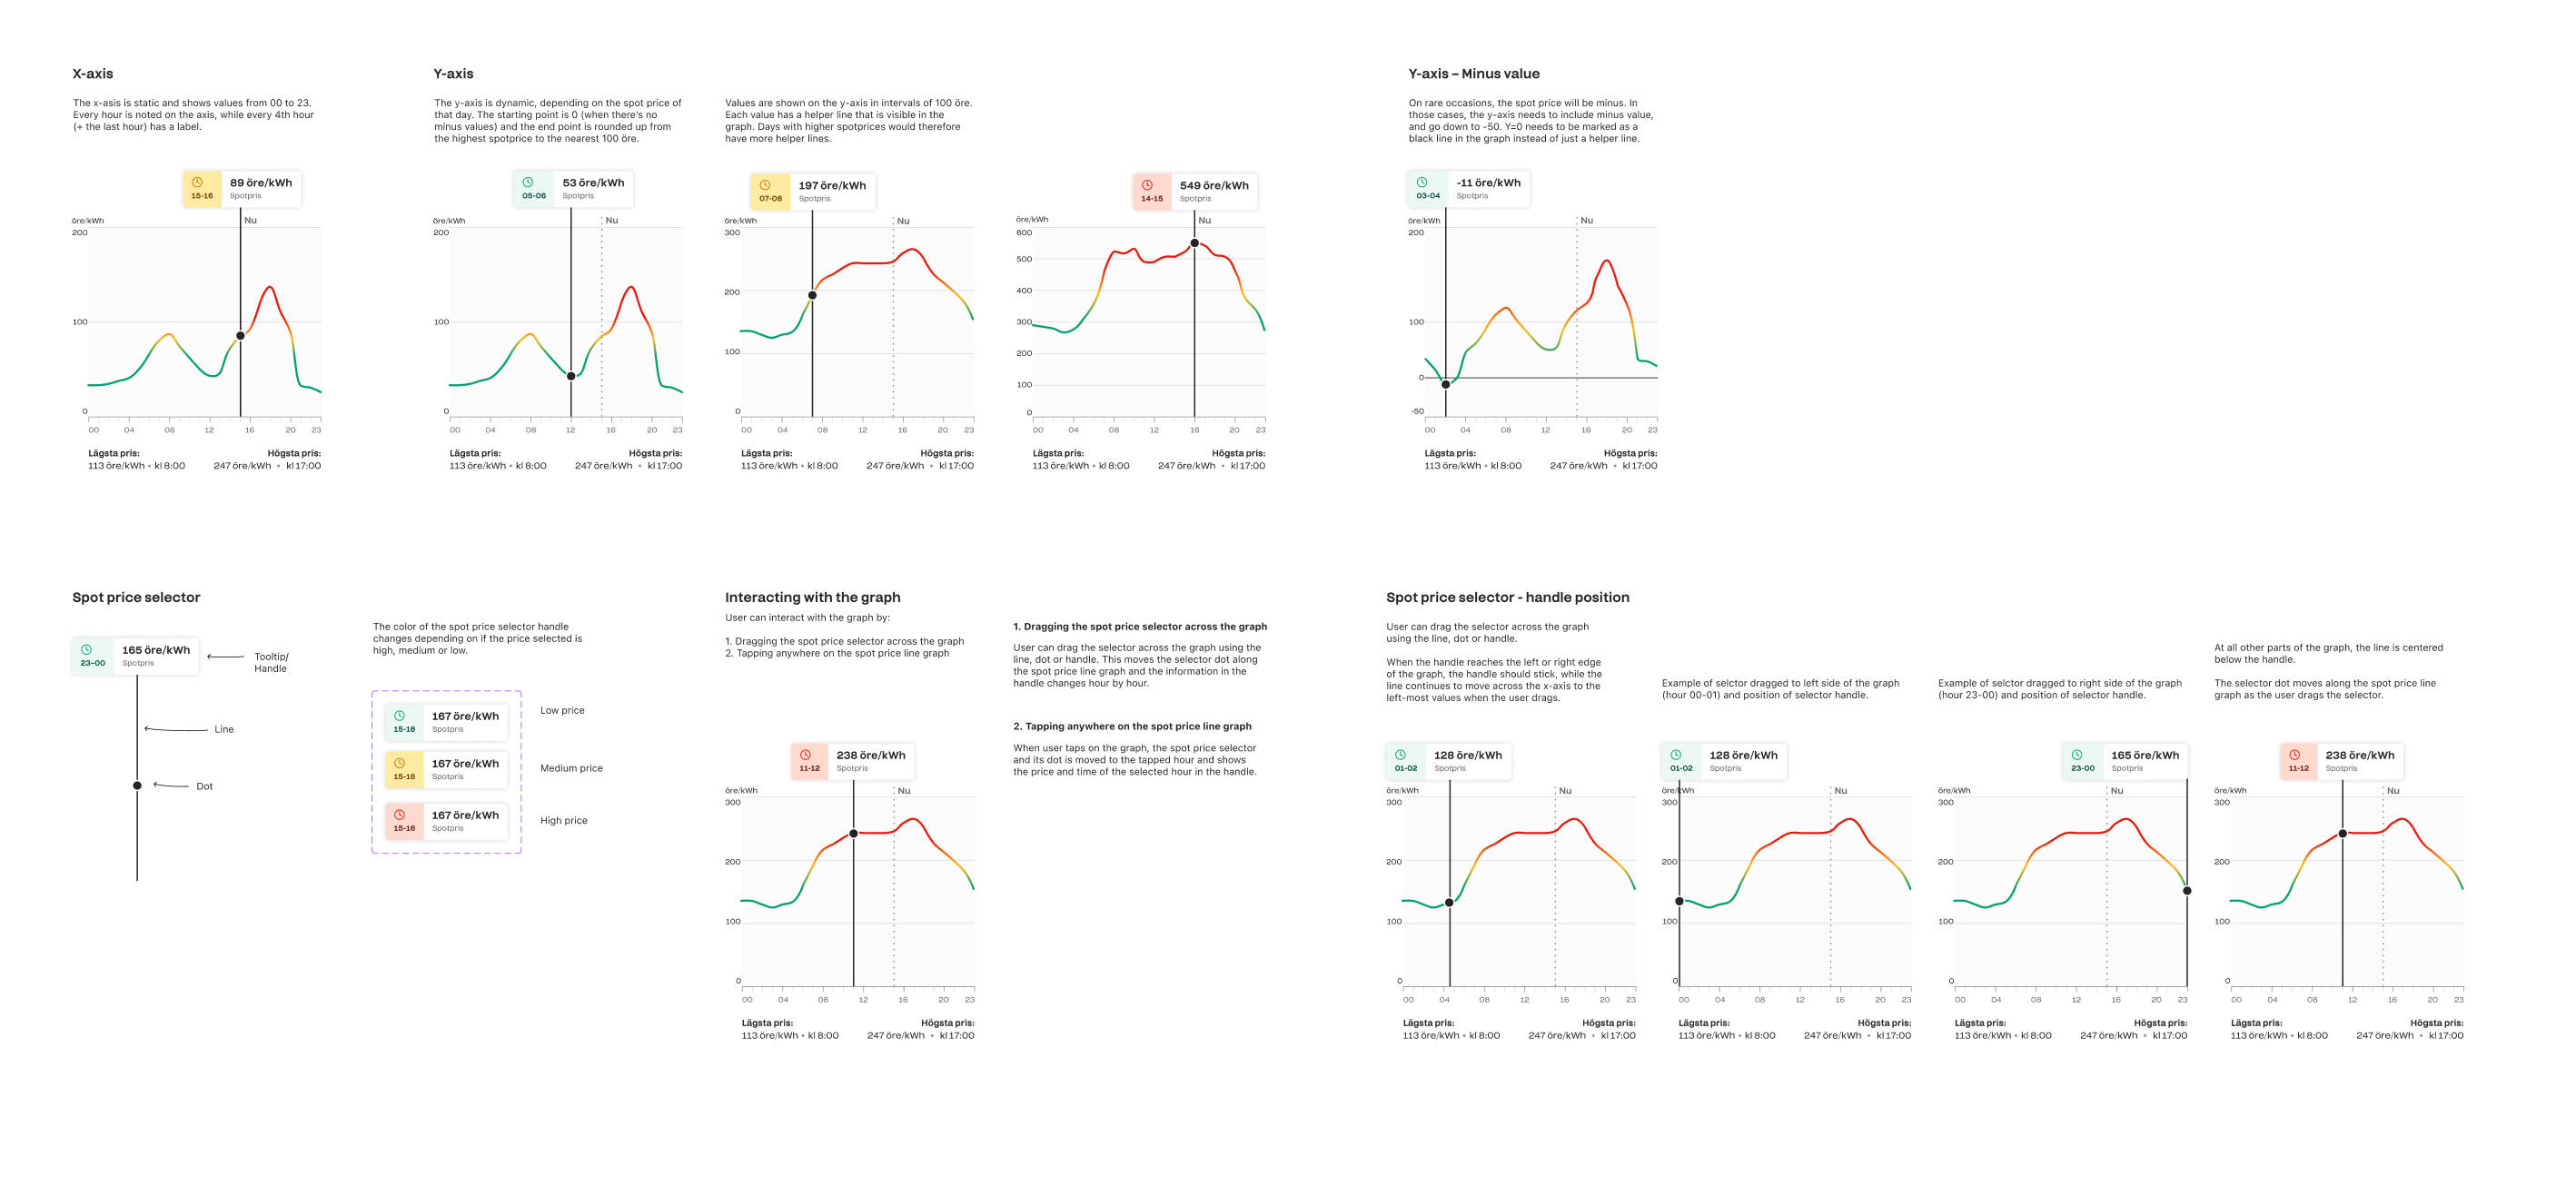
Part of my documentation of graph visualisation.
Time for launch
In just four months, we had an app ready to be released.
Unfortunately, only a few months after it went live, Telge Energi was acquired by Fortum, and the app was made redundant by Fortum’s own products.
Site content © 2025 Nina Westin


About

Contact


Telge Energi
Building a MVP app for consumers to track their energy consumption
Background
Telge Energi was lagging behind their competitors. After record electricty prices in 2022, their customers had an increasing awareness of the energy market and demanded better ways to track their energy consumption. An app was seen as a hygiene factor for an energy company of their size.
Our task
Get an MVP of the app out as quick as possibly to satisfy customer demand.
The client
Telge Energi was an energy provider based in Södertälje, Sweden.
my role
I was the Lead Designer and responsible for visual design in a team of a UX Designer, a UX intern, 3 Flutter developers and a BA
DELIVERABLES
UX design
Visual design
App design
Design system
Aligning on the vision
We started our work with Telge in a session to align on the vision for the app. I defined and facilitated the workshop, collecting stakeholders from across the business and bringing in feedback from users, to come together and create the vision for the app, and the must-have’s for the MVP.
Applying a new brand
We knew from the start that the app would be data and graph heavy, so the home tab was really the key place to apply more brand personality. Telge had just gotten a new brand identity done by Söderhavet and this was the first time it would be implemented in one of their digital products.
After some exploration, I settled on a bento-style grid to be able to give an overview of key data, while simultaneously bringing in the branded background.
Creating a design system
Part of my work was applying the new brand to digital, and building out a design system of components for the app. The app was built on the hybrid solution, Flutter, which meant the same app would be served up on both iOS and Android.
Visualizing data
Visualizing data was the key purpose of the app. Making sure the data was easy to grasp no matter what the the spot price was that day was key. I worked closely with our developers to define how the graphs’ y-axis dynamically change to always show the best view of the data.
Part of my documentation of graph visualisation.
Time for launch
In just four months, we had an app ready to be released.
Unfortunately, only a few months after it went live, Telge Energi was acquired by Fortum, and the app was made redundant by Fortum’s own products.
Site content © 2025 Nina Westin


About
Contact
Telge Energi
Building a MVP app for consumers to track their energy consumption
Background
Telge Energi was lagging behind their competitors. After record electricty prices in 2022, their customers had an increasing awareness of the energy market and demanded better ways to track their energy consumption. An app was seen as a hygiene factor for an energy company of their size.
Our task
Get an MVP of the app out as quick as possibly to satisfy customer demand.
The client
Telge Energi was an energy provider based in Södertälje, Sweden.
my role
I was the Lead Designer and responsible for visual design in a team of a UX Designer, a UX intern, 3 Flutter developers and a BA
DELIVERABLES
UX design
Visual design
App design
Design system
Aligning on the vision
We started our work with Telge in a session to align on the vision for the app. I defined and facilitated the workshop, collecting stakeholders from across the business and bringing in feedback from users, to come together and create the vision for the app, and the must-have’s for the MVP.
Applying a new brand
We knew from the start that the app would be data and graph heavy, so the home tab was really the key place to apply more brand personality. Telge had just gotten a new brand identity done by Söderhavet and this was the first time it would be implemented in one of their digital products.
After some exploration, I settled on a bento-style grid to be able to give an overview of key data, while simultaneously bringing in the branded background.
Creating a design system
Part of my work was applying the new brand to digital, and building out a design system of components for the app. The app was built on the hybrid solution Flutter, which meant the same app would be served up on both iOS and Android.
Visualizing data
Visualizing data was the key purpose of the app. Making sure the data was easy to grasp no matter what the the spot price was that day was key. I worked closely with our developers to define how the graphs’ y-axis dynamically change to always show the best view of the data.
Part of my documentation of graph visualisation.
Time for launch
In just four months, we had an app ready to be released.
Unfortunately, only a few months after it went live, Telge Energi was acquired by Fortum, and the app was made redundant by Fortum’s own products.
Site content © 2025 Nina Westin
About
Contact